
Did you miss Tableau’s Conference this year? Here is a summary of the main new features coming up in future versions of Tableau products. The new features were presented by different speakers so they vary in level of detail. (Download available at the end of the post).
Future Investment in Tableau will be focused in seven areas:
- Visual Analytics
- Performance
- Data Preparation
- Storytelling
- Enterprise
- Cloud
- Mobile
I- Visual Analytics.
1-Type-in Shelves.
In addition to dragging fields to the shelves, you will also be able to type-in fields. Autocomplete alternatives will be presented.

Type-in Shelves
2- Freeform Calculations
You will be able to type calculations directly in the Columns or Rows shelves without having to create a new field. Autocomplete alternatives will be presented.
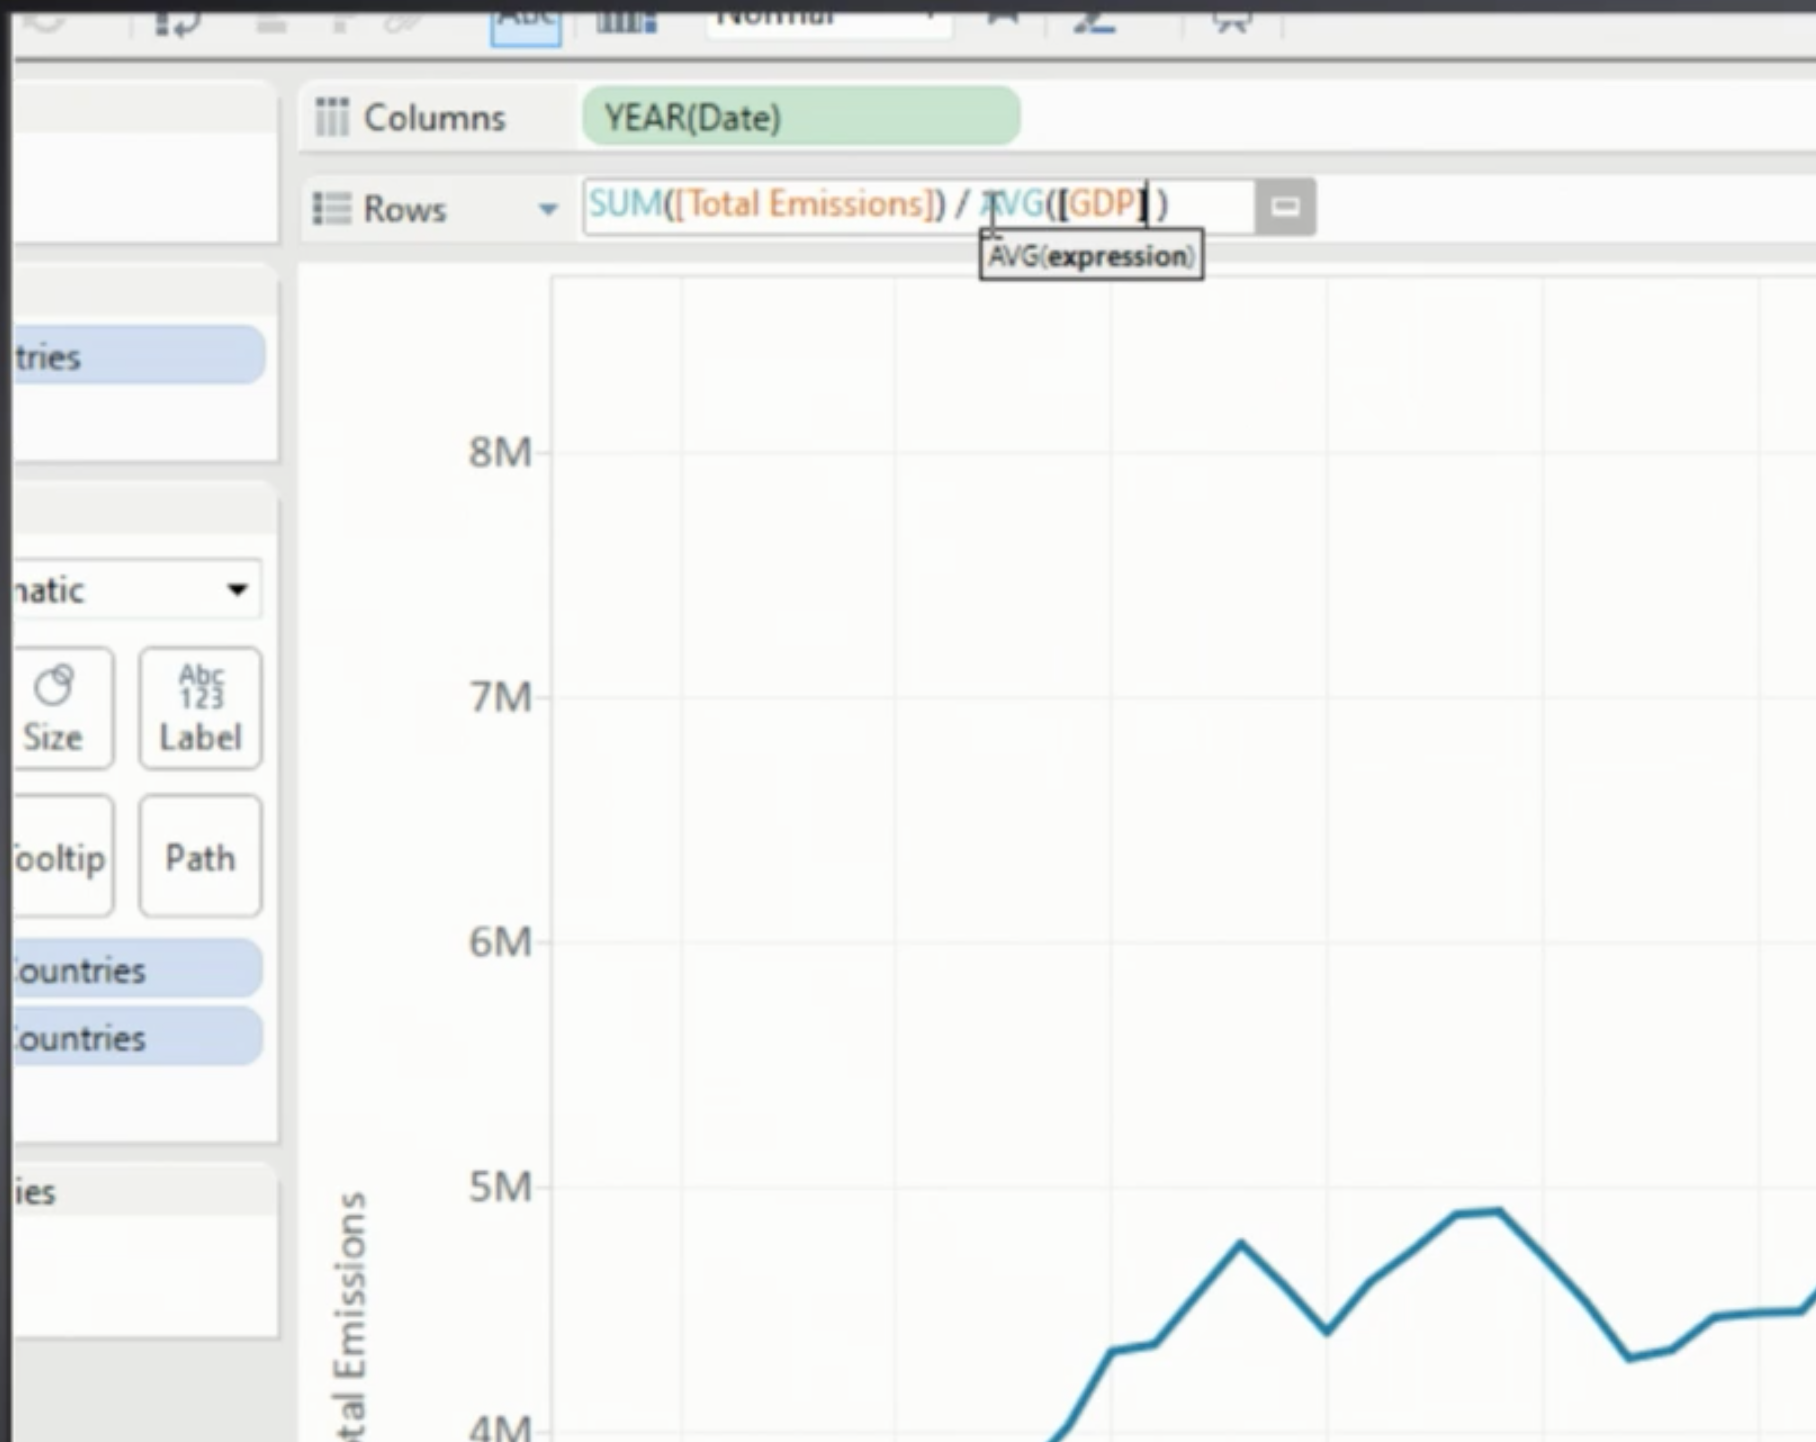
Free Form Calculations
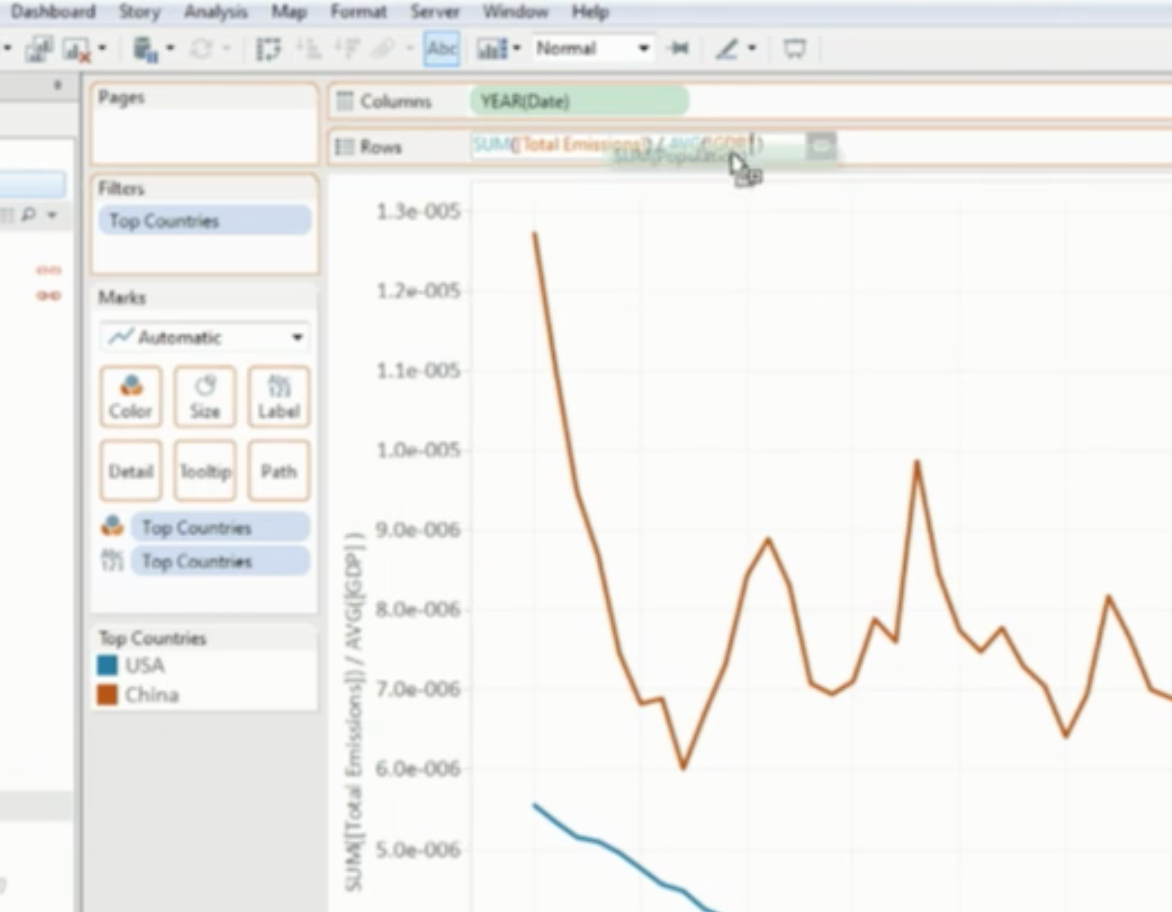
3- Drag and Drop Calculations
This new feature also includes the ability to drag and drop fields directly into the calculation on the shelf.
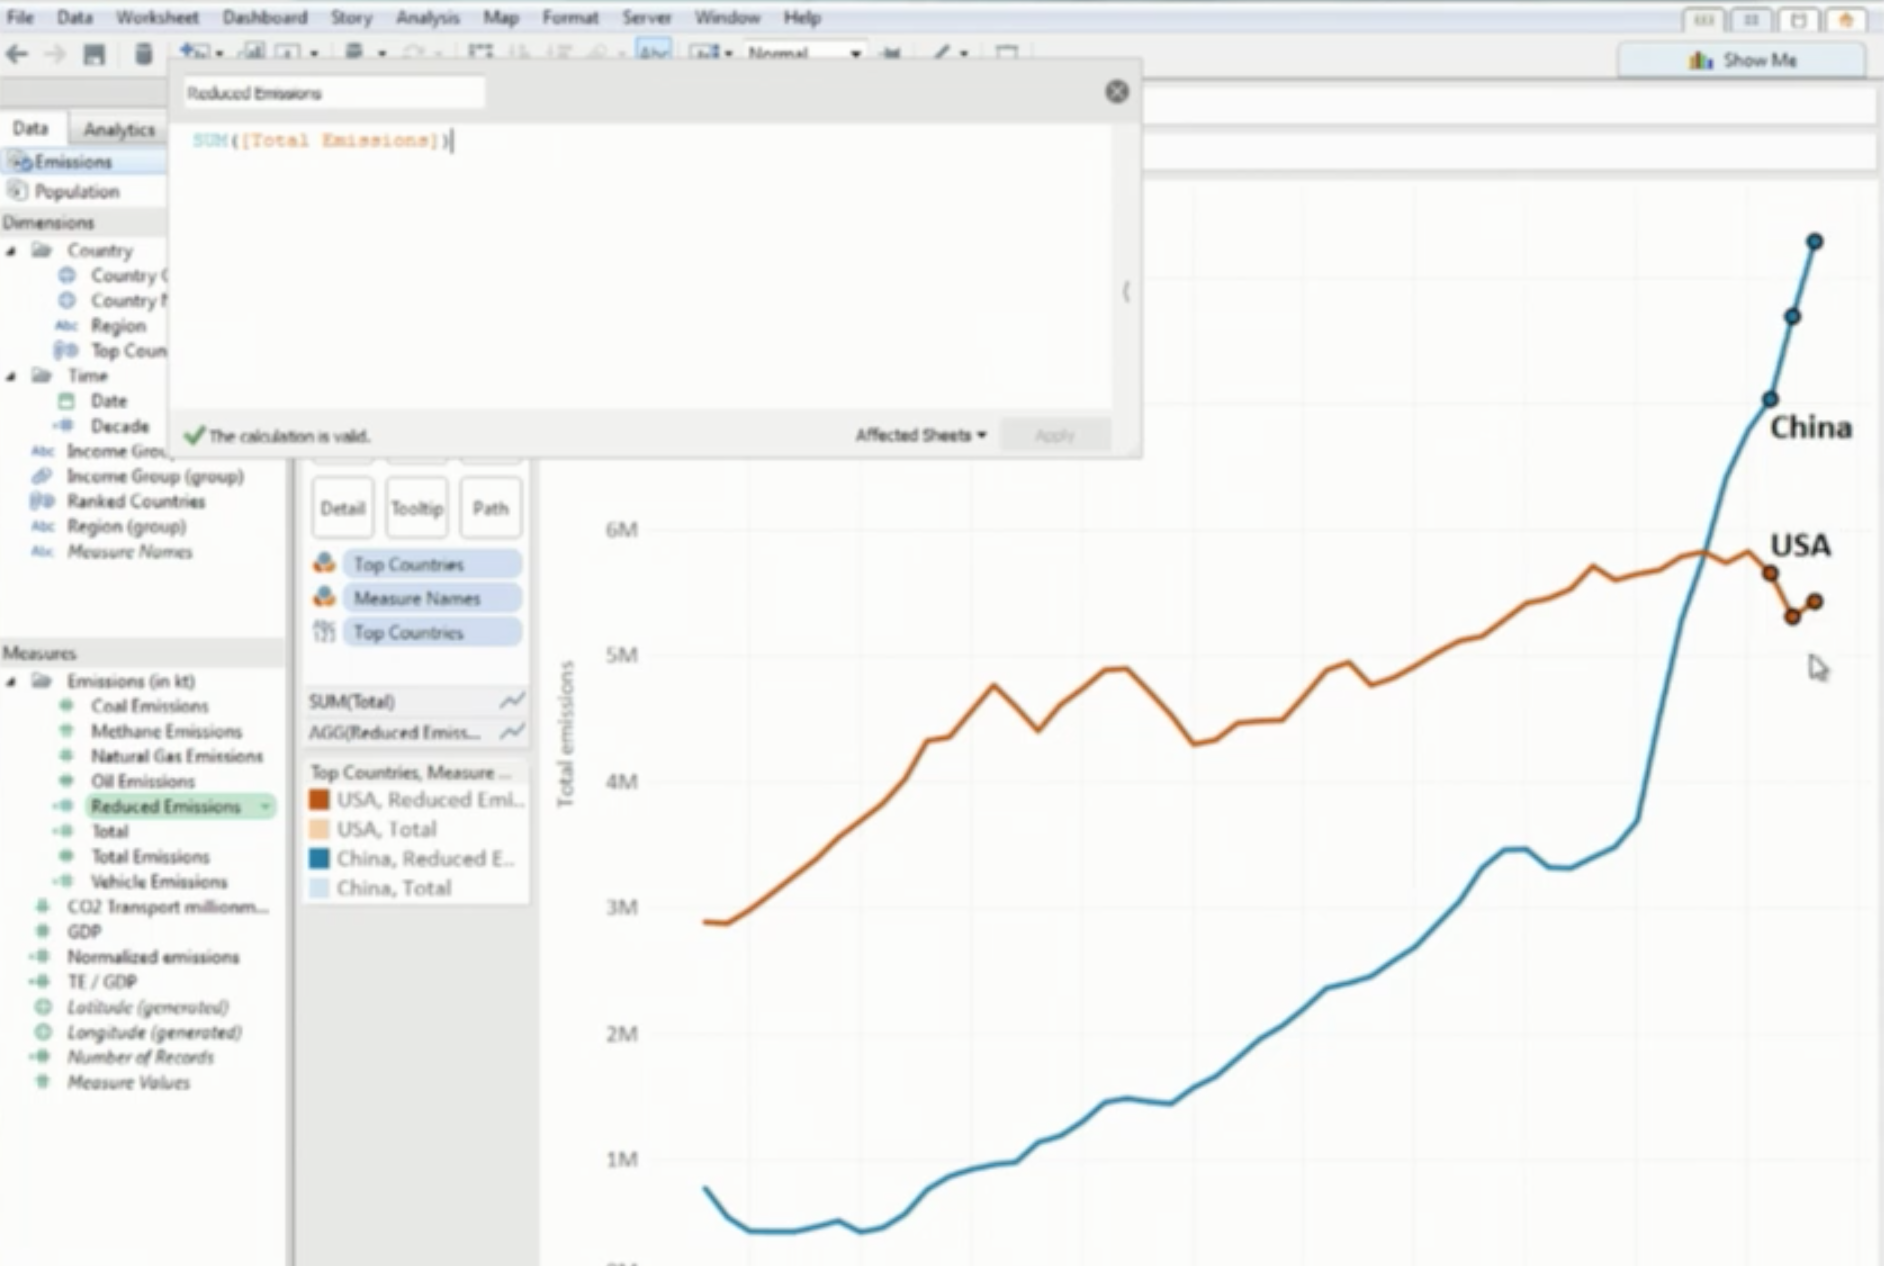
Drag and Drop Calculations
Once you are done creating your calculation on the shelf, you can take the newly created calculation and drag it into the Measures shelf so it becomes a permanent field in the data model.

New Field
4-New Calculations Editor
It looks much simpler than the old editor, but it is actually more powerful. One of the things it allows you to do is to interact with the data while using the editor. It provides auto complete and as formulas are changed, visualizations are updated.
New Calculations Editor
The editor also supports drag and drop, so fields can be dropped directly on the editor.

New Calculations Editor – Drag and Drop
5-Drag and Drop Analytics
There is a new Analytics Pane. It contains the objects used to summarize, model and forecast data.

New Analytics Pane
6- Instant Reference and Trend Lines
You can now drag and drop reference and trend lines. Also forecasts, medians, quantiles, box plots and more.

Drag and Drop Trend Lines

Drag and Drop Forecasts
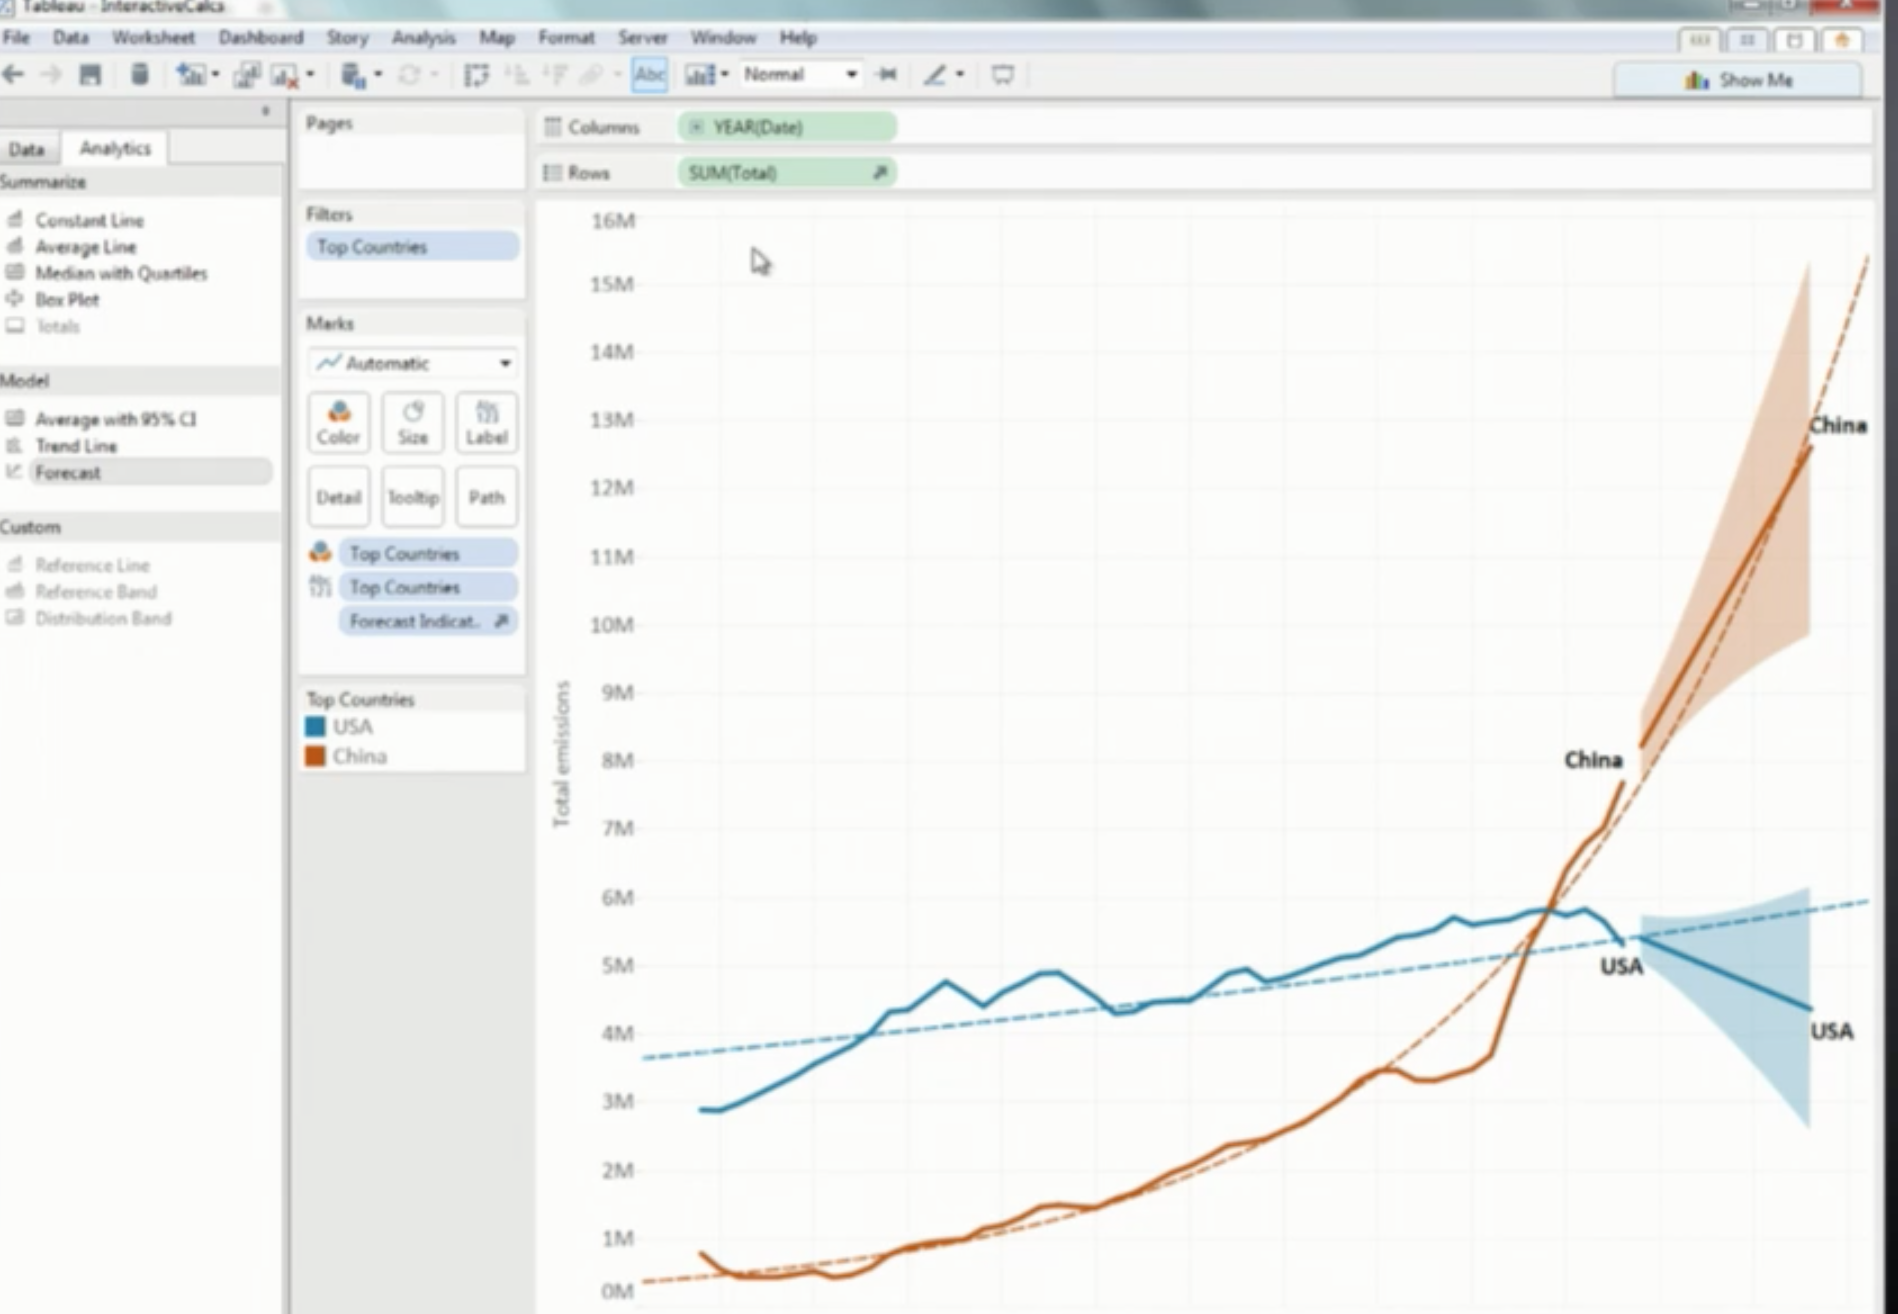
Trend Lines and Forecast
7- Interactive table calculation editing
As powerful as table calculations are, they are sometimes confusing. Table across? table down? The new editor highlights how the data is being calculated once an option has been chosen on the editor. In the image below, there are three bars highlighted indicating how data points are being used in the calculation (Table Down).

Interactive Table Calculation Editing
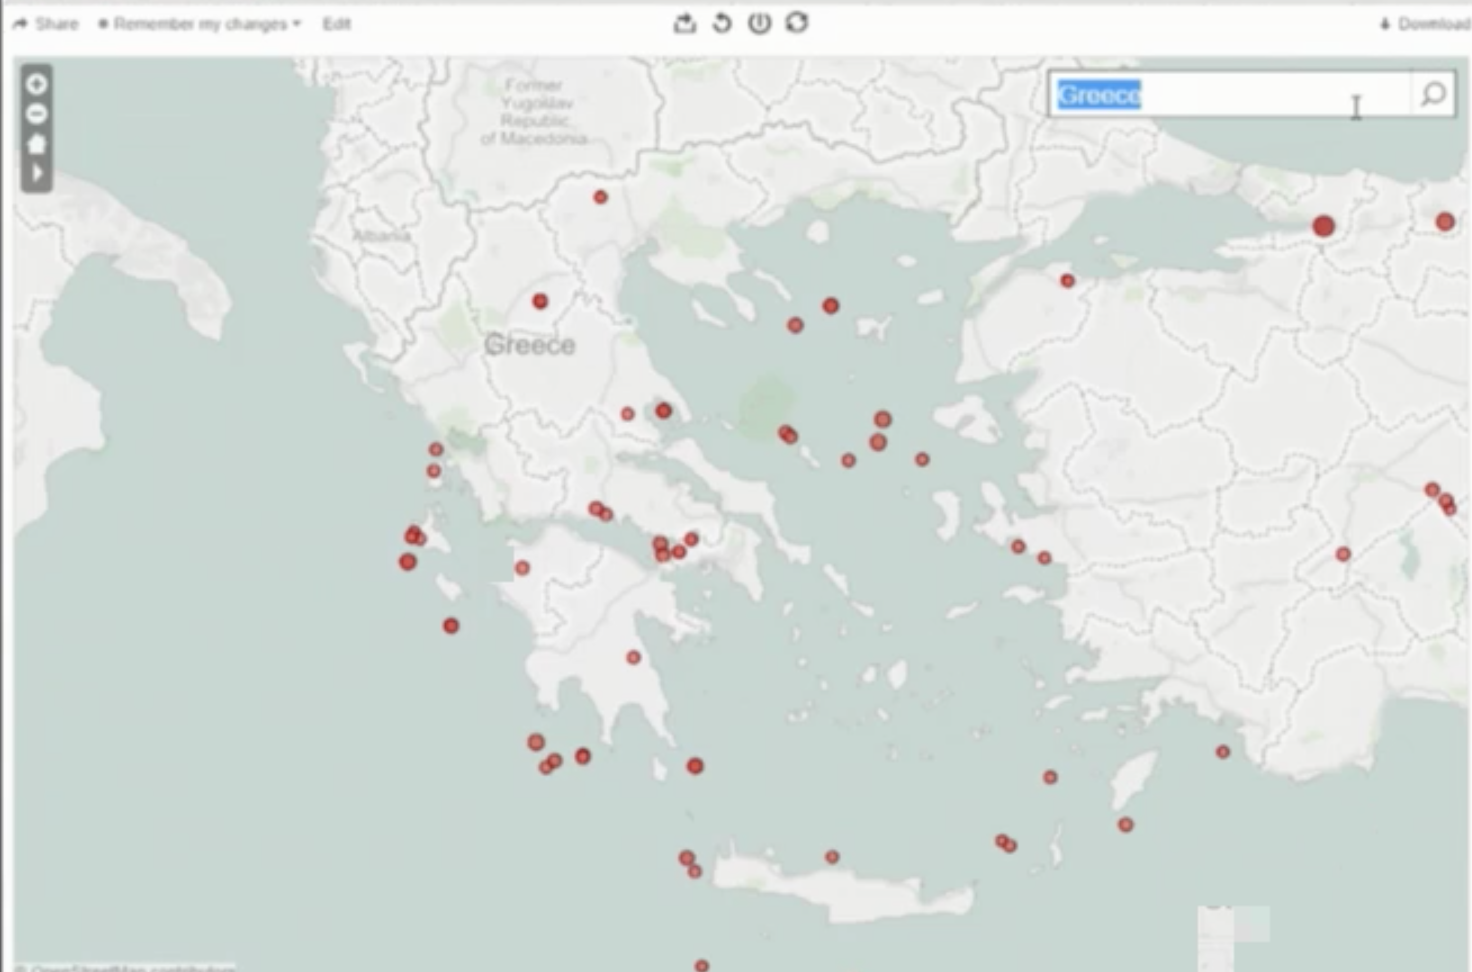
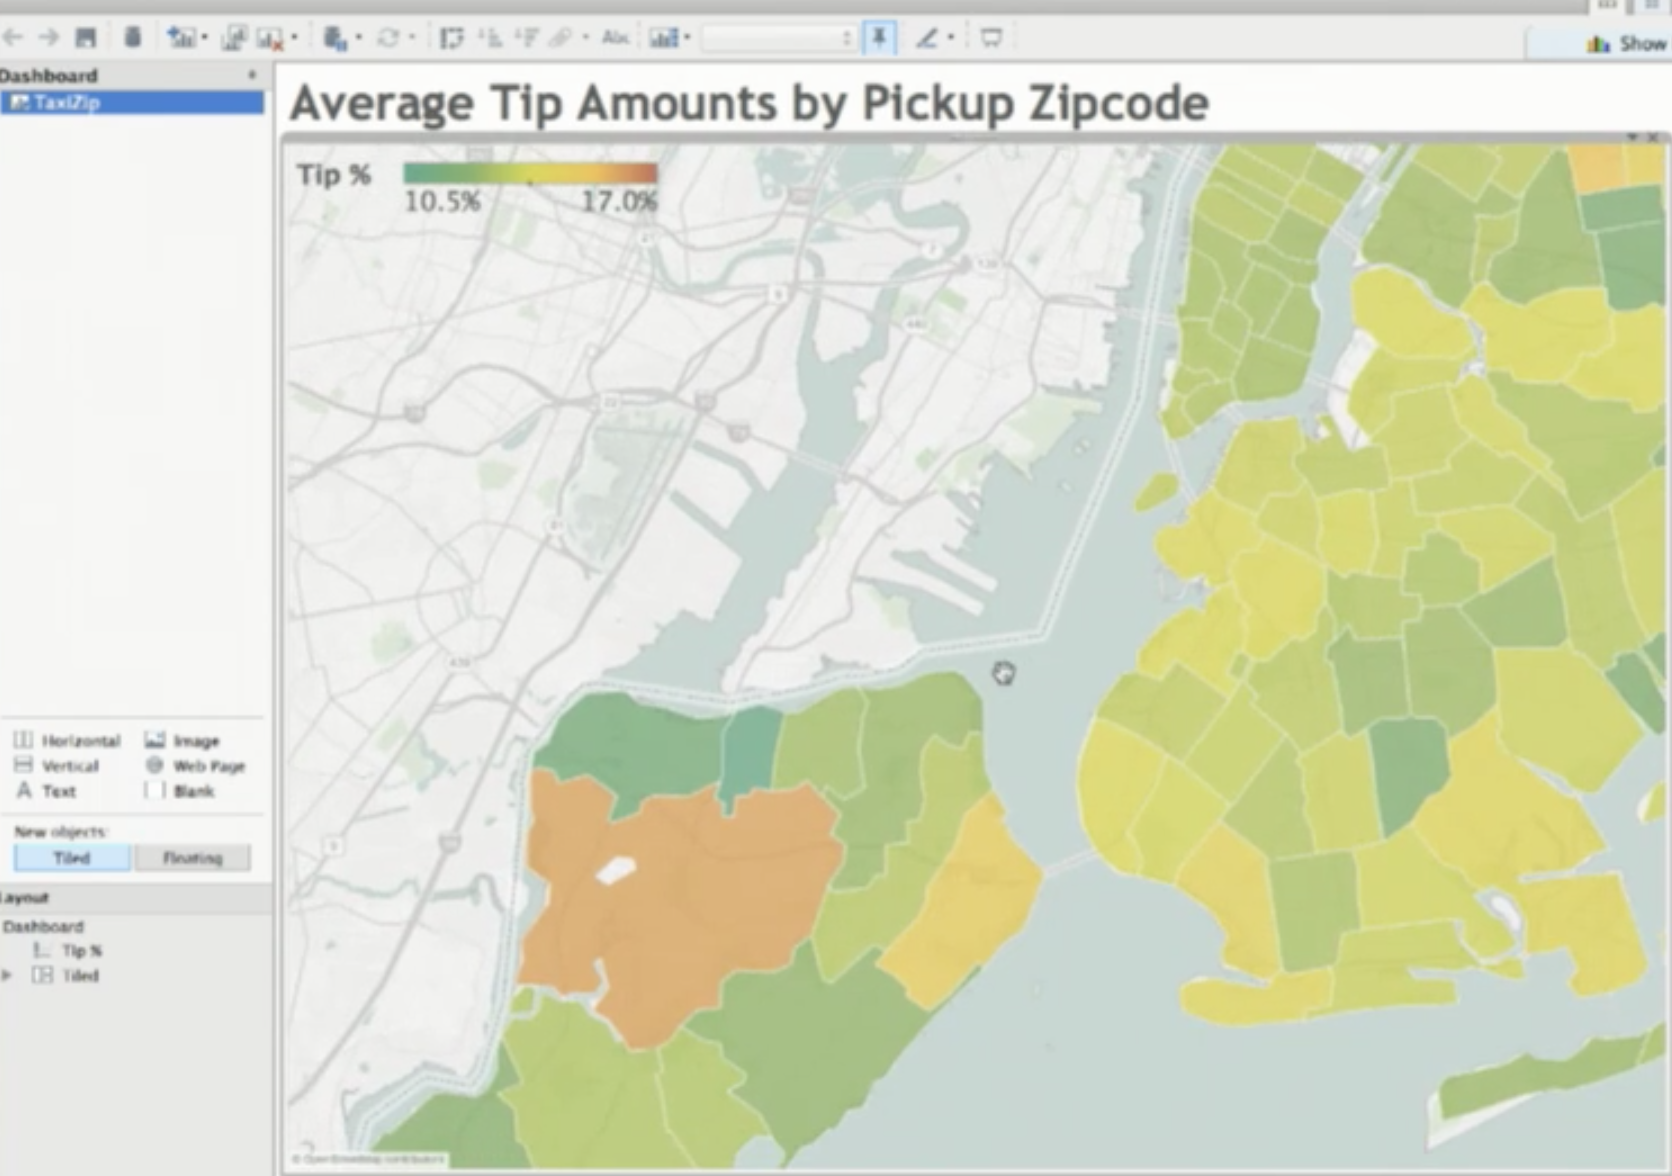
8- Improved geographic search
You can type in any geographic data point and the view will focus on it. Typing Greece zooms in to Greece on the map. And Country is not even part of the data. The geographical knowledge has been built into tableau.
Improved Geographic Search
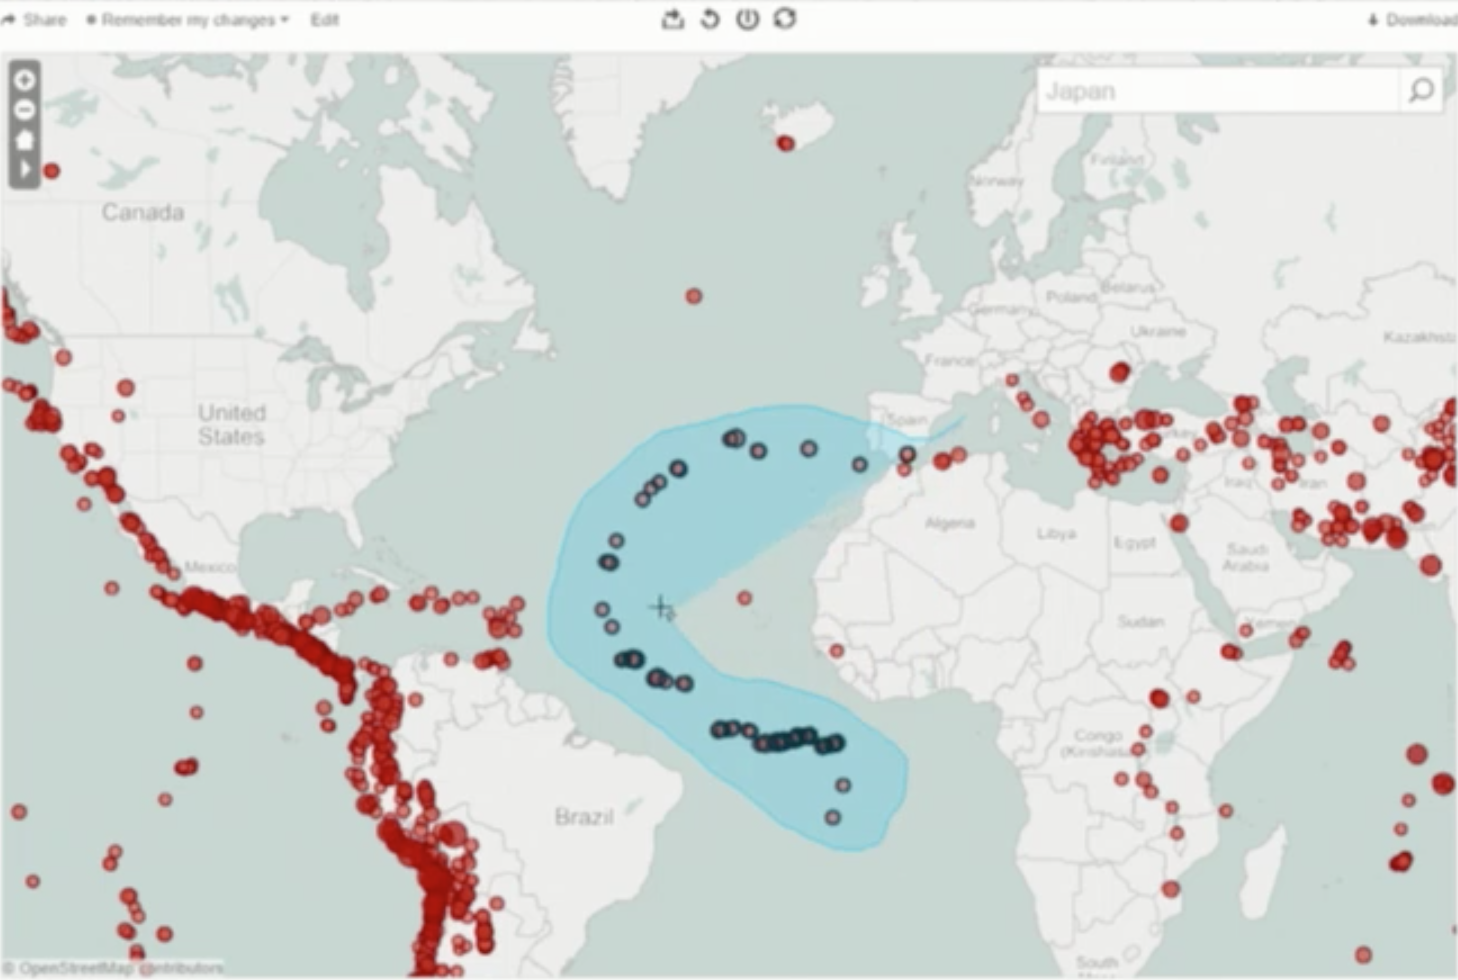
9- Radial and Lasso Selections
Radial Selection
You will be able to select marks around a specific point.

Radial Selection
Lasso Selections
You will be able to select exactly the marks you need (irregular shapes).
Lasso Selections
II. Performance
1- Multi-core query execution and vector operations support
The ability to leverage multi-core query execution increases the speed of the data engine. In demo systems queries are running 3 to 4 times faster.
2- Parallel queries
To improve performance on connections to live databases, tableau is working on sending multiple queries to these systems in parallel which reduces overall execution time building a dashboard. This also allows the database itself to share computations between related queries.
Dashboard – Multiple Queries
To build a dashboard like the one above, execution may look like this (Each bar is one query and tableau will run them one after the other).

Query Execution
By overlapping these queries and running them in parallel the overall time to build the dashboard will be reduced.

Query Execution in Parallel
3- Continuous Tooltips
Currently, tooltips are displayed as you are interacting with a data point. As you move the mouse, the tooltip disappears and reappears once the mouse is over a new point. Future tooltips will be continuously shown to reflect the new point you are interacting with without opening and closing.

Continuous Tooltips
4- Responsive Pan and Zoom
Currently as you focus on specific areas of your maps, the image disappears and reappears as you pan. In the future, as you pan to focus on specific areas of your maps, information will be immediately displayed on the screen so you can keep focus on your data.
Responsive Pan and Zoom
5- Persisted Query Cache
To scale the speed across all the organization, this feature will allow tableau to share query results among multiple users so they won’t have to be recalculated for each user (i.e. A user calculates the median for a large dataset, and if another user also needs the same calculation, it will be shared with that user). The next time someone opens the workbook, the calculation will be available instantly as it will have be already calculated. Persisted query caches will be shared among all processes on all nodes of the cluster, so that all users can benefit from the cache equally.
III. Data Preparation
1- Automatic Split of a data field
The visual connector is being improved so that we can automatically split a data field. Take a look at the table below, where the data field “Loan Info” has 3 pieces of information. Tableau will be able to automatically detect this and split the data into the 3 corresponding fields.

Automatic Split of a Data Field
After selecting the split option, Tableau will take the Loan Info field and split it into 3 fields that you can rename accordingly.

Split Data
The option to split a data field can be also be selected right on a viz:
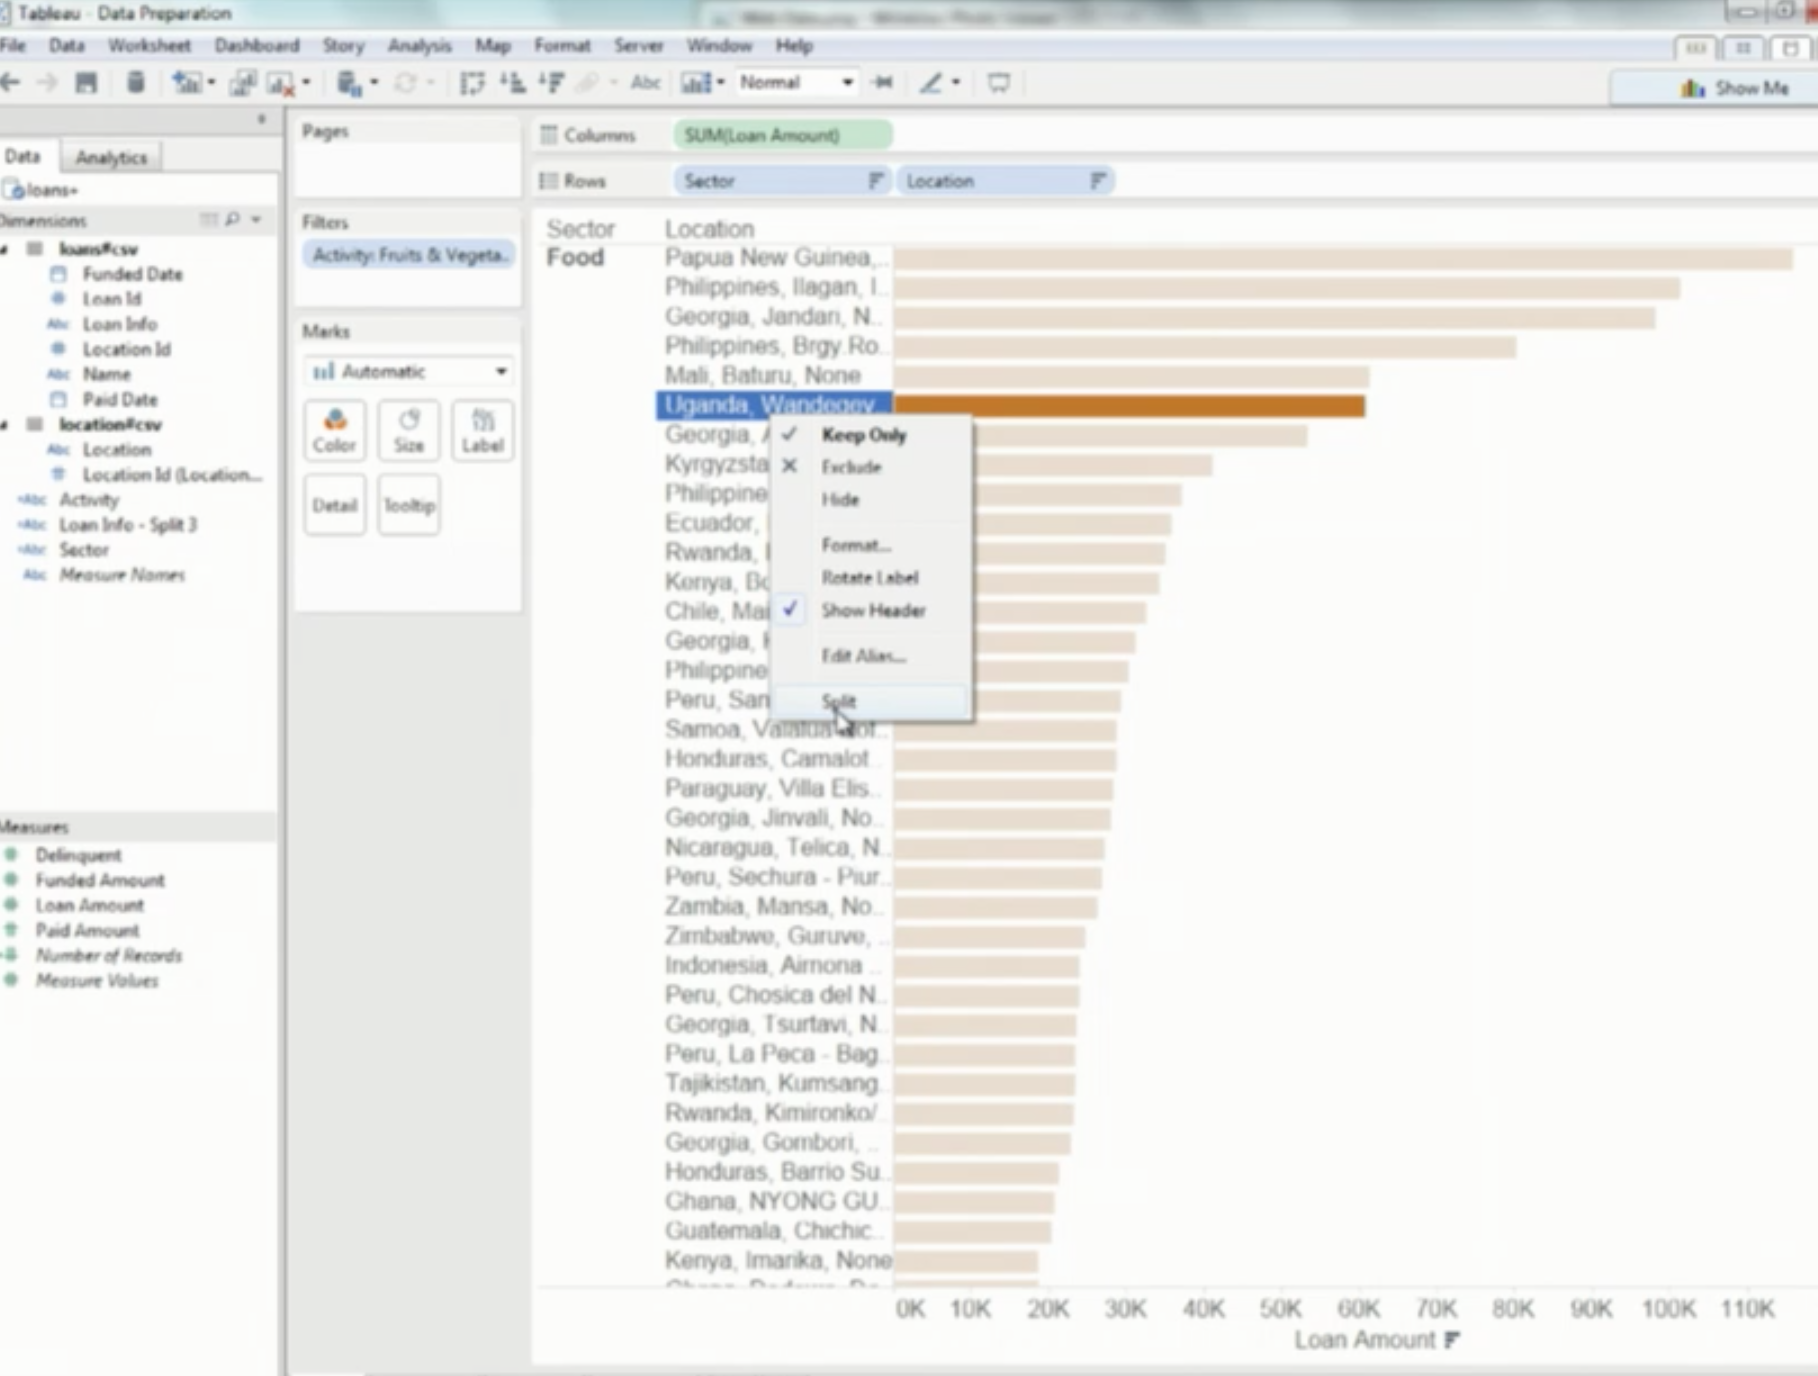
Data Split on a Viz
2- Pre-processing of Excel data
Sometimes the data we get in an excel format is not ready for use in Tableau. We have to remove extra headers, empty lines and columns, and sometimes reshape it. Tableau will in the future automatically preprocess the data so that this work doesn’t have to be done manually.

Excel Data
We will see something like this when connecting to an excel file:

In this example, we don’t want each year to be in a separate column, so the data can be further preprocessed by selecting the “Unpivot” option to reshape the data. And the resulting reshaped data will be ready for Tableau.

Another interesting example is the pre-processing of survey data:

Survey Data
After loading and un-pivoting, data will be ready for analysis

Preprocessed Survey Data
3- Web Data Connector.
There will now be an option to connect Tableau to internal web services, Rest APIs, and JSON data. You will need to write a script in Javascript and HTML, and then use the Web Data Connect option to point to the script. The data will then be loaded into Tableau.

Web Data Connector
A script example:

Script Example
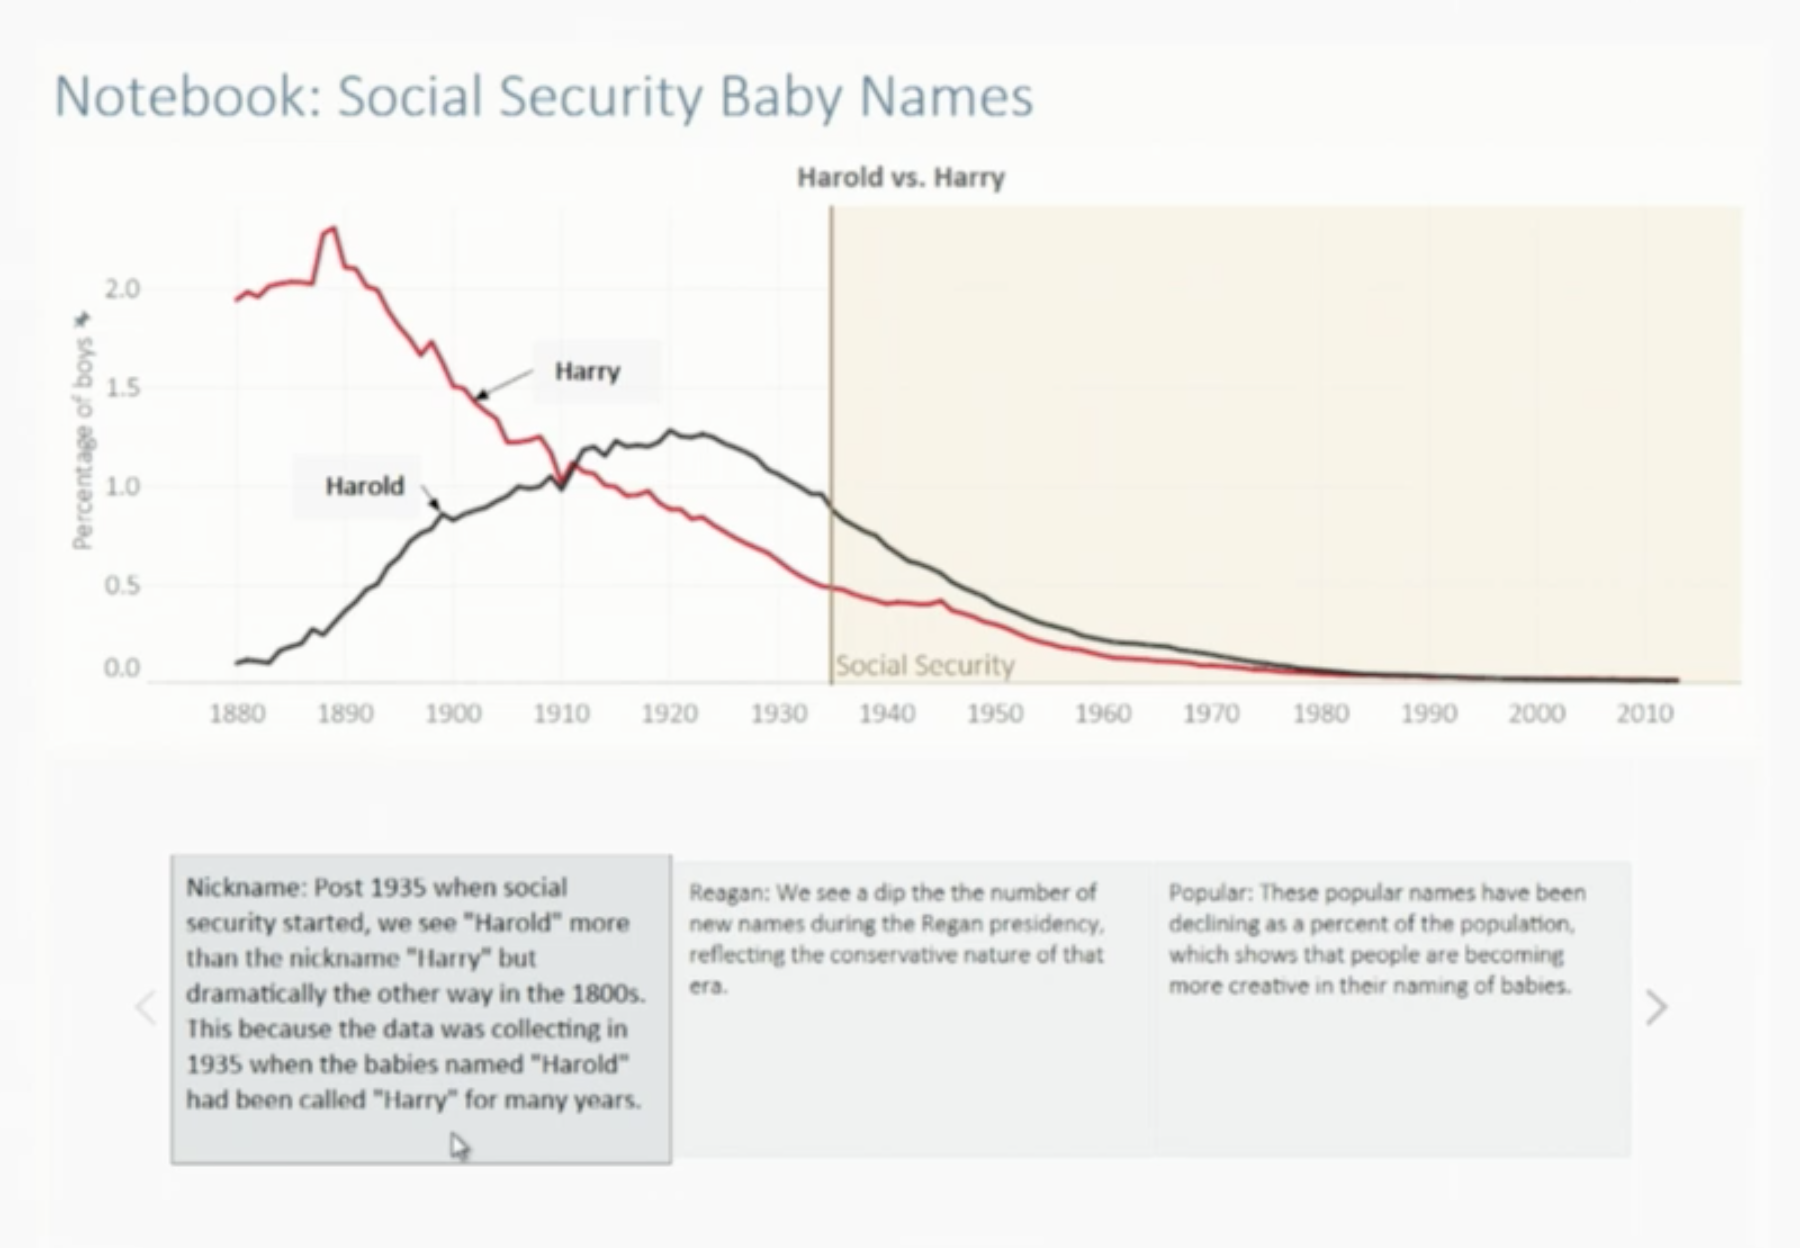
IV. Storytelling
1- View Thumbnails
In worksheets with multiple worksheets and dashboards, it is sometimes difficult to find which charts to add to the story. To facilitate this process, thumbnails are being added.
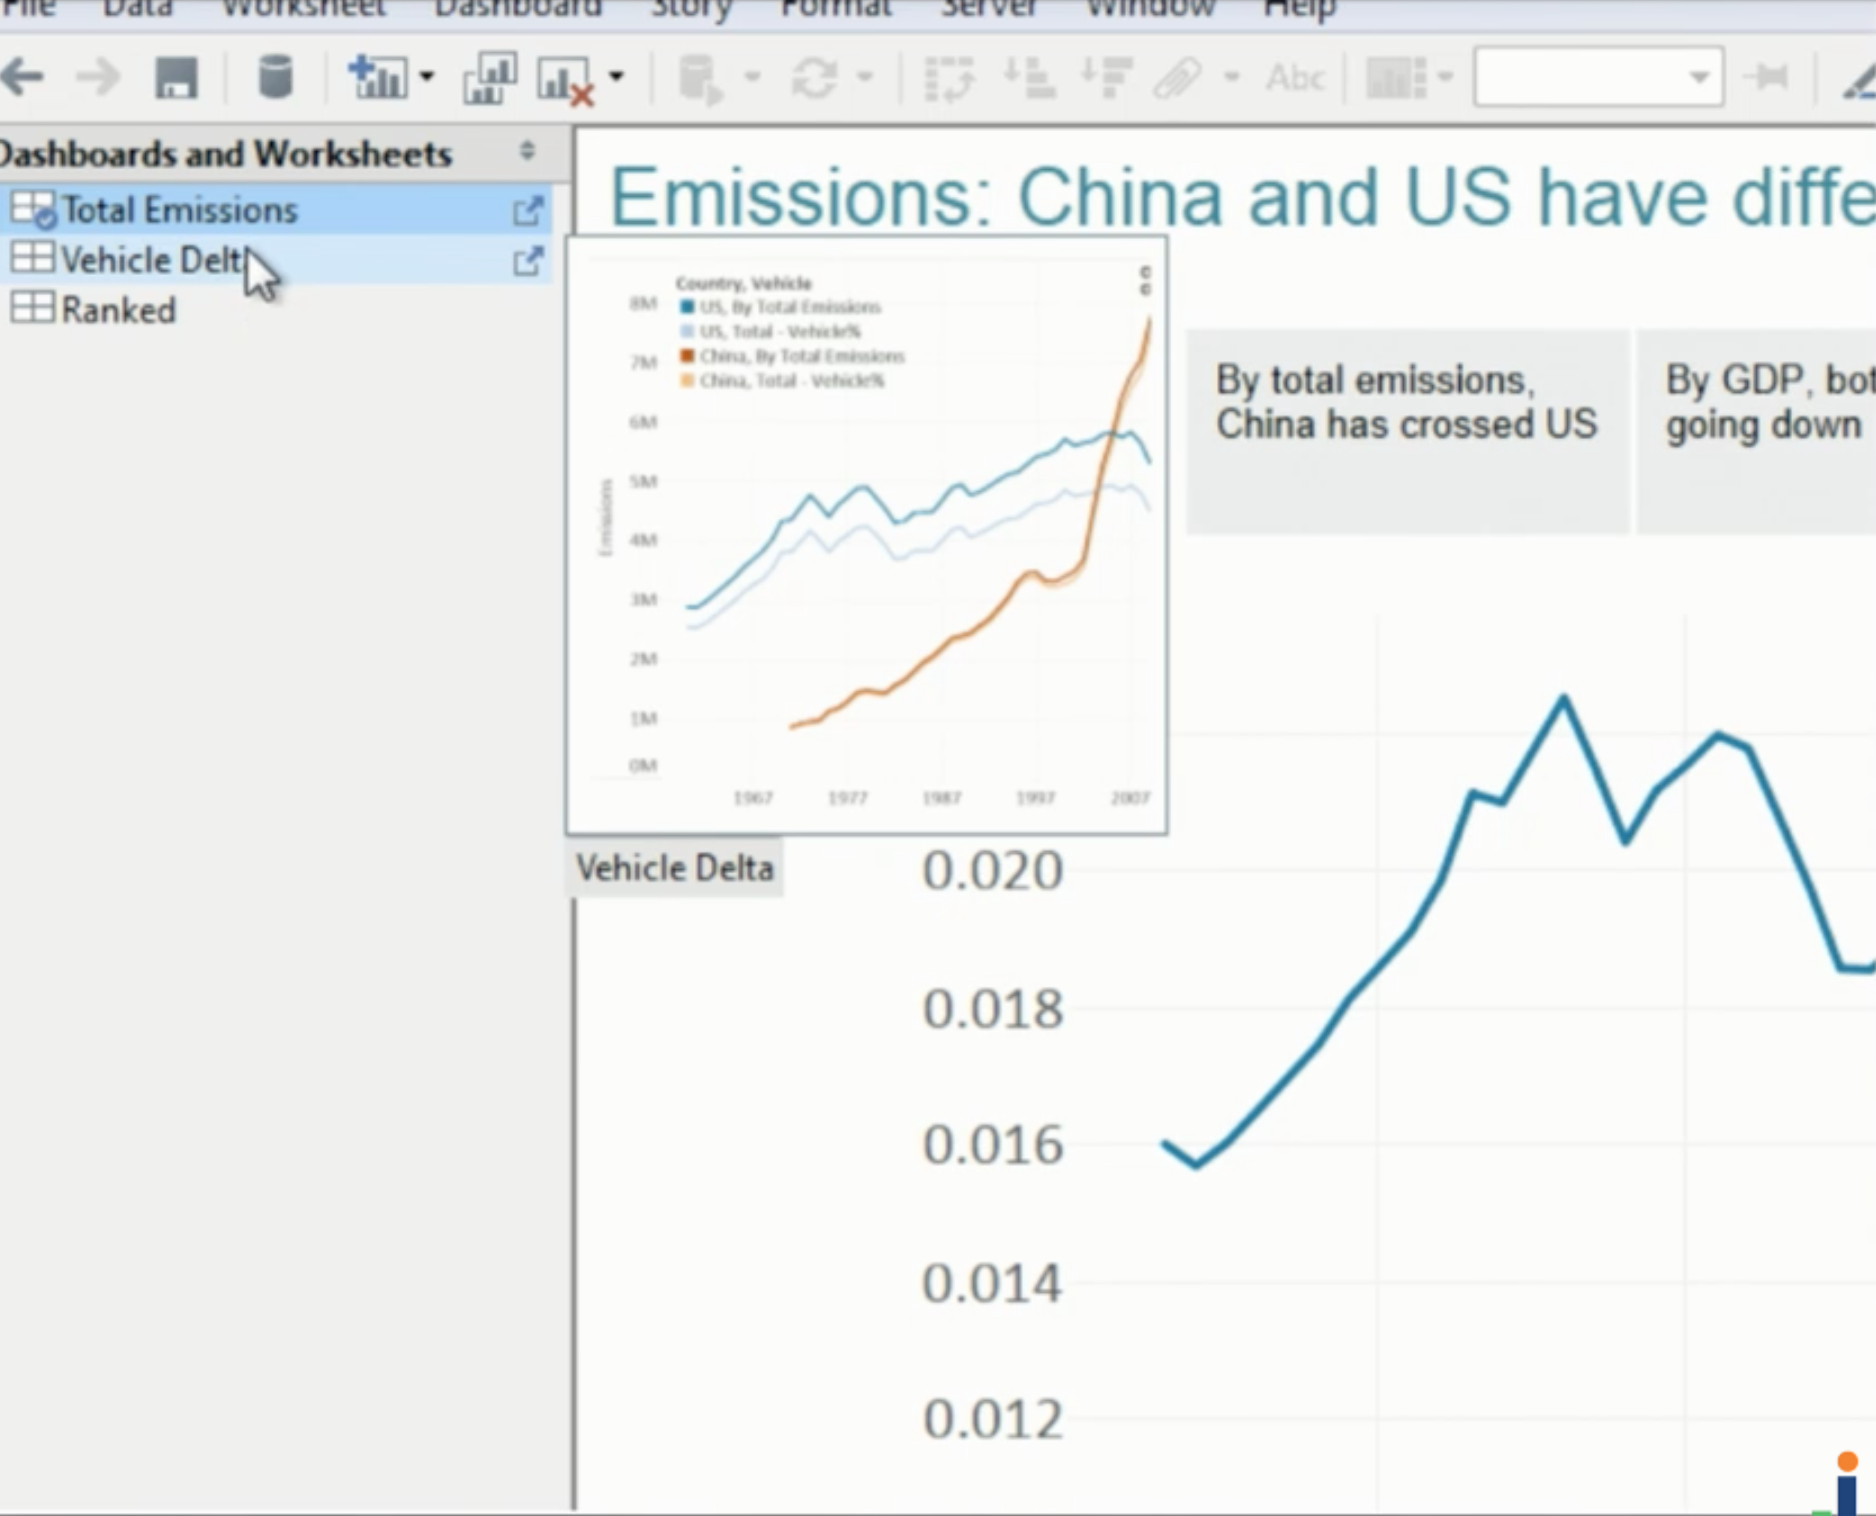
Storytelling Thumbnails
2- Format Options
Control over fonts and colors will be given to the user. Stories won’t have to be just gray.
Format Options
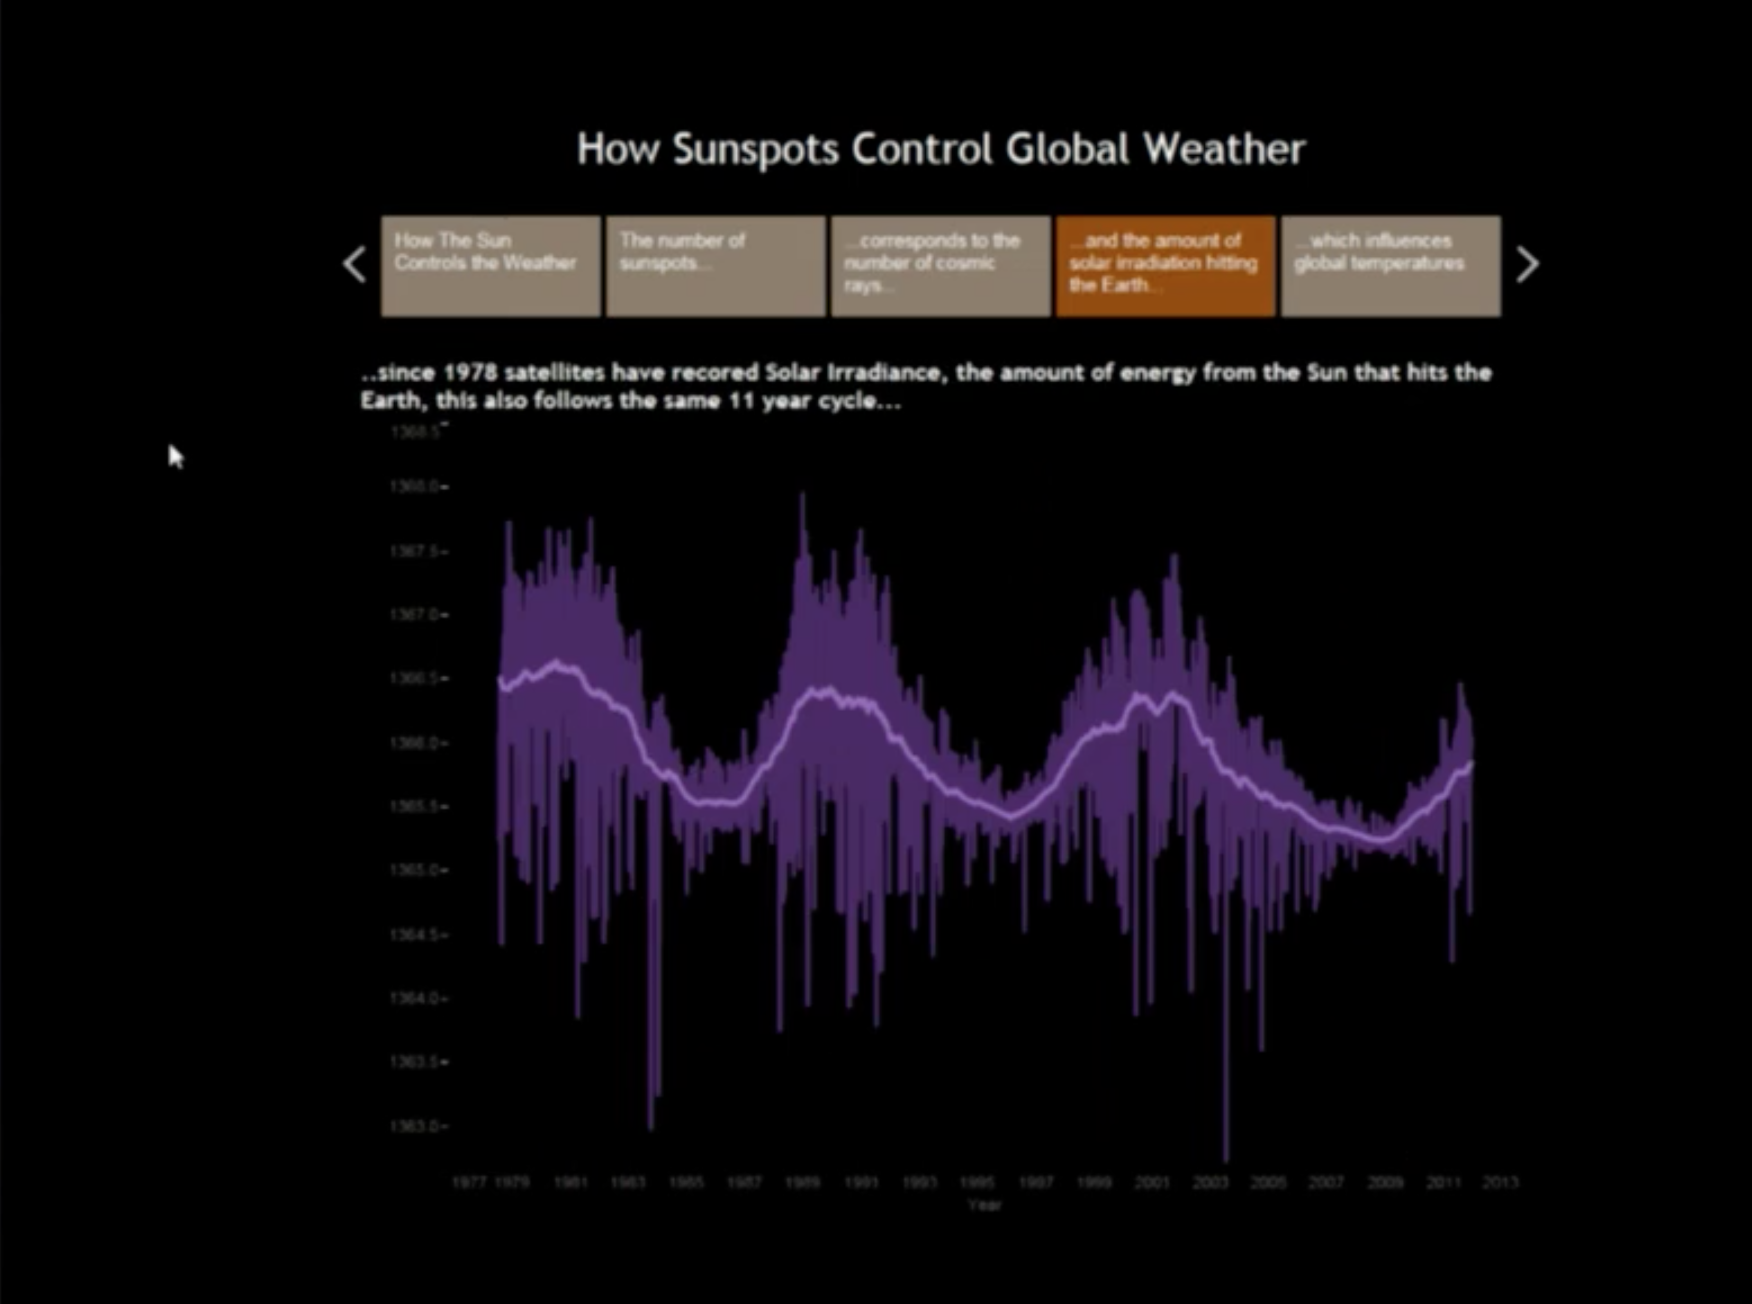
3- Linear Navigator
There will be an option to add a navigator appropriate for linear story telling. (Small boxes with numbers encouraging people to step through the story).

Linear Navigator
4- Custom Navigator
You will be able to change the navigator size and position.
Custom Navigator
V. Enterprise
1- High Availability Management (Ease of Use)
High availability will be easier to manage, with faster failover detection and unlimited active data engine nodes.
2- Kerberos Support
Tableau will support Kerberos (a user authentication standard used across enterprises to provide single sign on authentication from the client all the way to the database).
3- Smartcard Support
If your organization uses smartcards, you will now be able to login directly from Tableau desktop.
4- APIs
APIs have been created to enable new extensibility, automation, and integration of your tableau deployments. Right now there are 3 APIs available: Javascript, Data Extract, and REST. In the next versions, features will be added to include the most requested functions for these APIs such as publishing content and assigning permissions programmatically.
5-Breadcrumbs
For each view on Tableau Server, information on where this view comes from will be provided (which workbook, which project). This way you will be able to navigate server more easily.

Breadcrumbs
6- Workbook Pages
Every workbook will have a page with a workbook description, and details on all the views on the workbook, its data sources and permissions.

Views

Data Sources

Permissions
VI- Cloud
Tableau considers that 4 things are required to have a true cloud offering:
1- Ability to connect to cloud sources
Tableau already offers live cloud to cloud connection for data that lives on the cloud so you can see data updated up to the minute. (Google analytics, Google Big Query). More data sources will be added as they are important sources of business data.
2- Ability to connect to business applications in the cloud (Salesforce – Oauth)
You can keep salesforce data up to date via oauth.

Oauth
3- Ability to connect to on premise data sources
Currently the top two data sources used with with Tableau Online are Excel and sql server. The challenge is how to keep on premise data fresh. A new capability called Tableau Data Sync is being added, and it will help you publish on premise data to tableau online. Your machine will act as a secure agent to push local data up to the cloud on a schedule that you define.
4- Getting analytics to where you do your work
It is important to provide the ability to push dashboards to wherever they are needed. Recently the ability to embed interactive dashboards into salesforce was added. Now an add-in has been released that works with heroku and the salesforce canvas toolkit. All visualizations embedded in salesforce will be updated automatically.
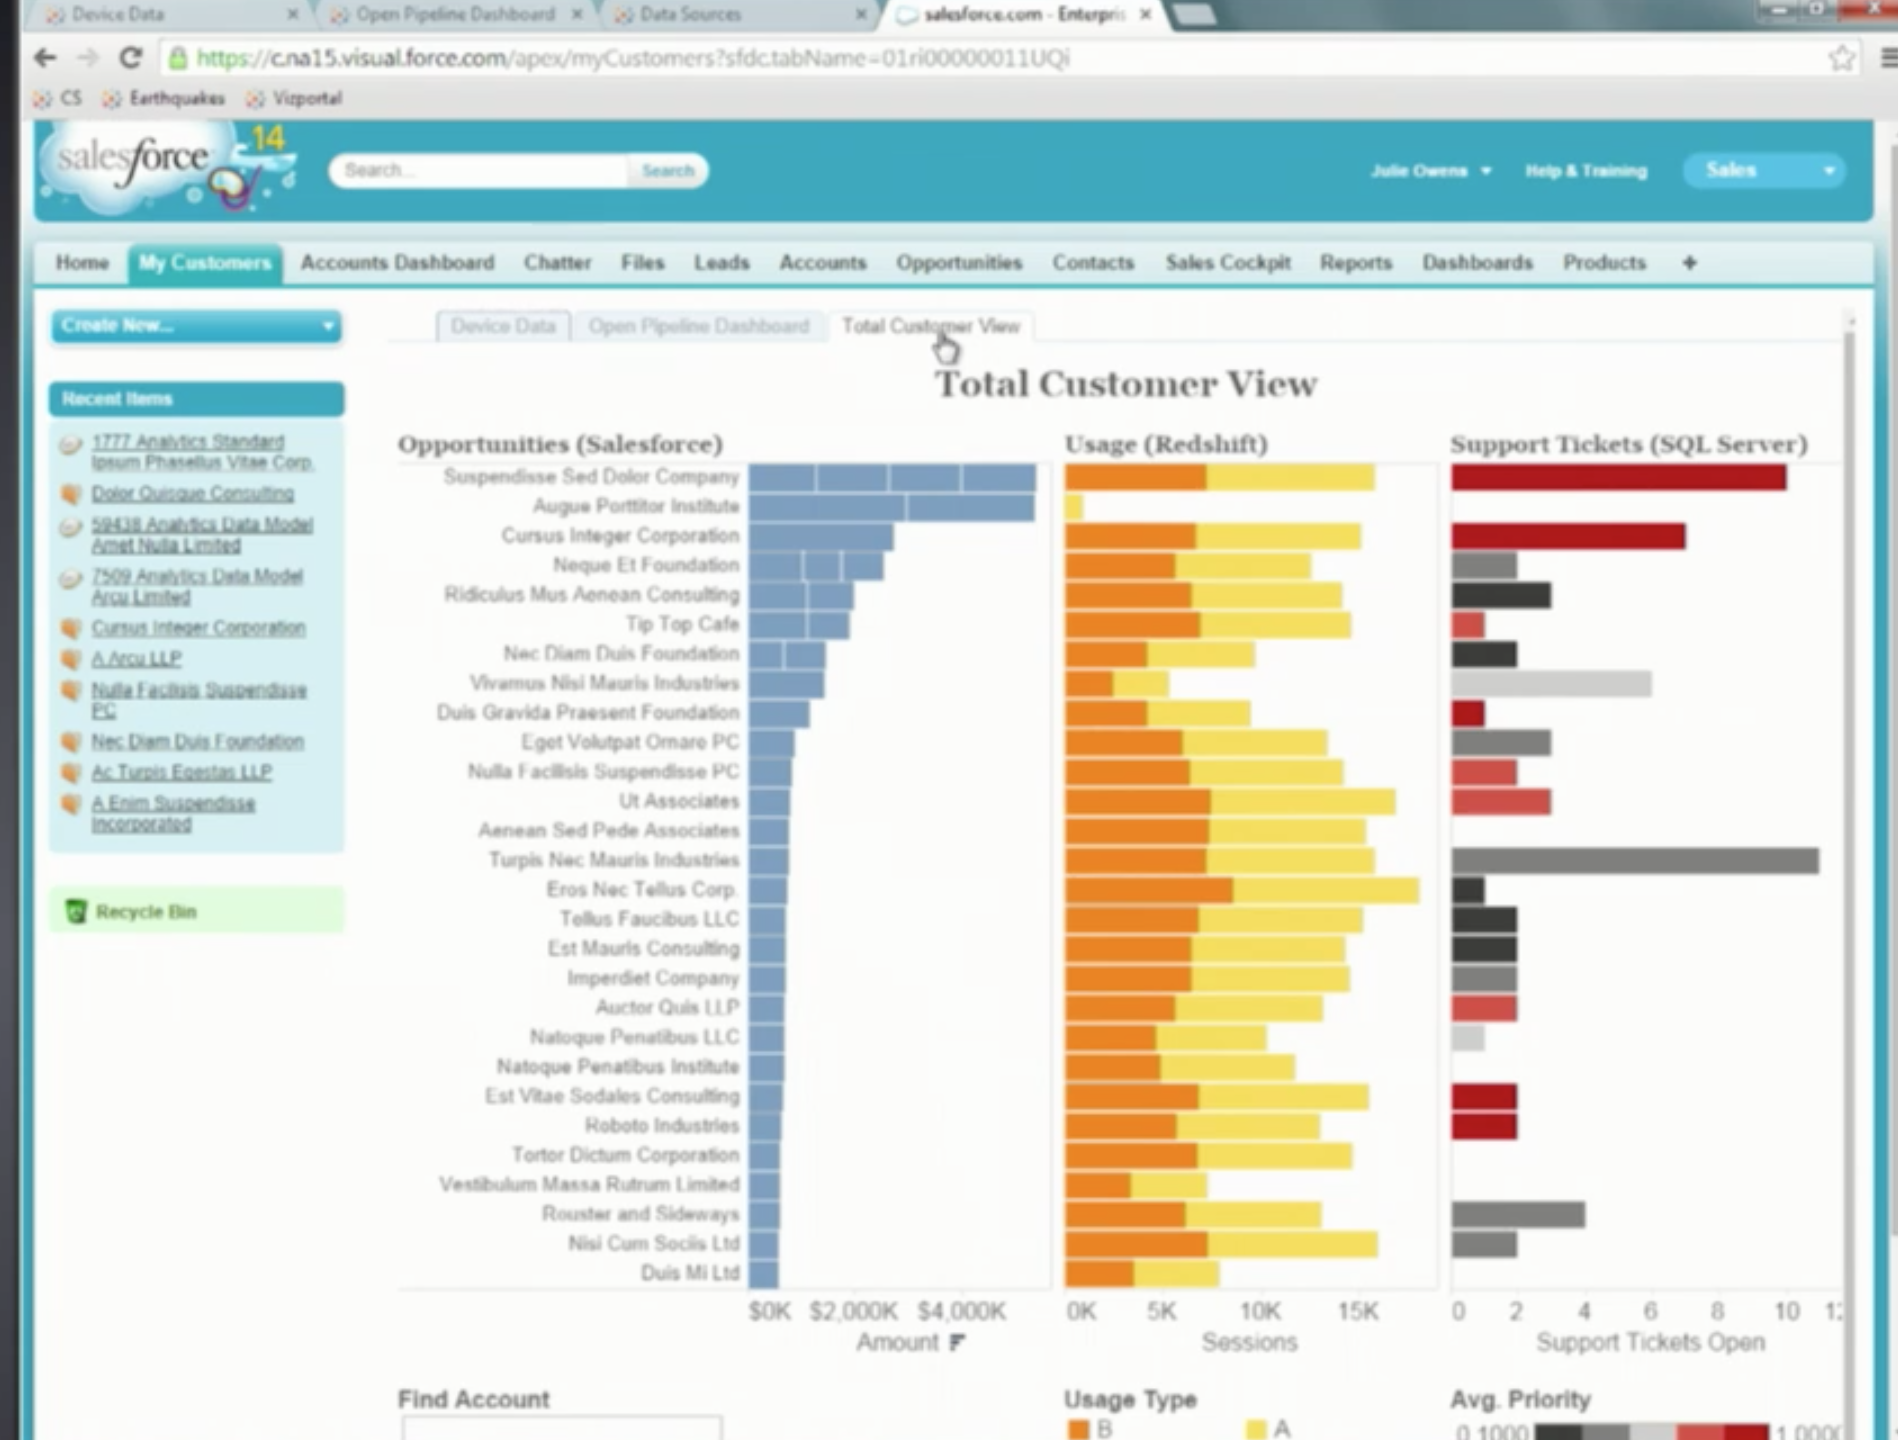
Embedded in SalesForce
VII- MOBILE
Tableau Mobile will have a new native User Interface. It has been fully rewritten to be faster and to show information coming live from the server fast.
1- Calculations are being brought to mobile
You will be able to tap on the measure, select “Create Calculated Field” and the calculation editor will open up. All new drag and drop capabilities will be added to mobile. Products are being designed to be web, mobile and desktop ready at the same time.

Mobile Calculations
2- Favorites
Favorites will be displayed front and center.
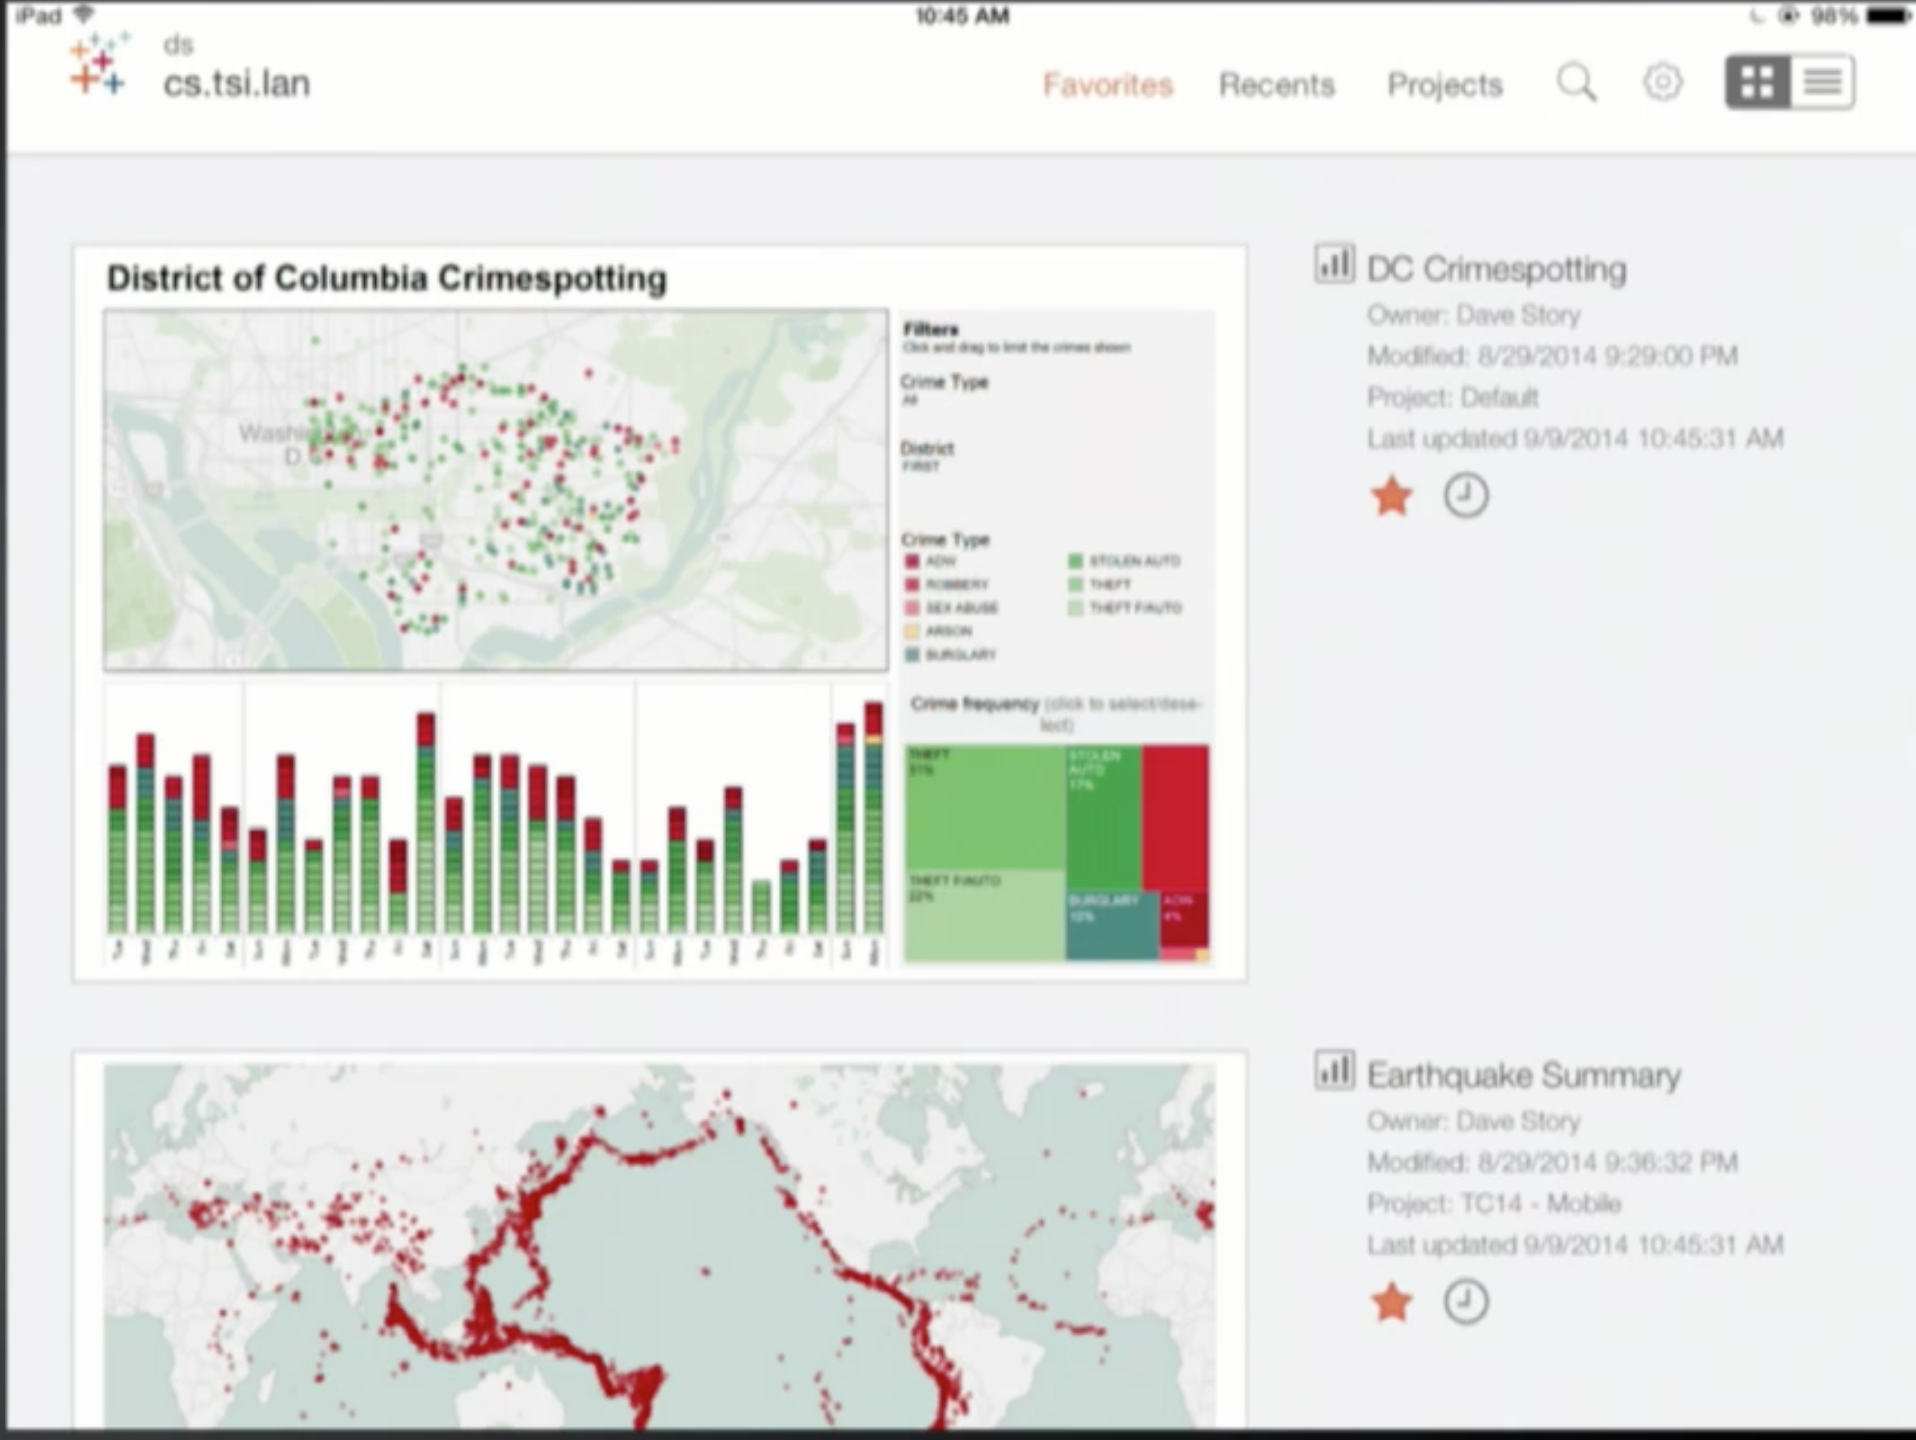
Favorites
3- ability to swipe through worksheets
4- Offline Access to Favorite Worksheets
You will be able to view your favorite dashboards even when you are offline. You can select how often you want your worksheets to be fetched, and Tableau Mobile will fetch them when you are on the network.

Offline Access
5- New Visualization Mobile App (Elastic)
What do you do if you have just a tablet and you get an email with a table in it. You want to understand and see your data, but don’t have Tableau or a Server. Tableau is building a new app that will provide a new experience to explore your data, as easy as using a pencil. It will be fun and fast. And it will stretch the definition of mobile analytics. This project is called elastic and you can sign up to receive updates on this project at http://www.tableausoftware.com/be-elastic.

Open File with Elastic
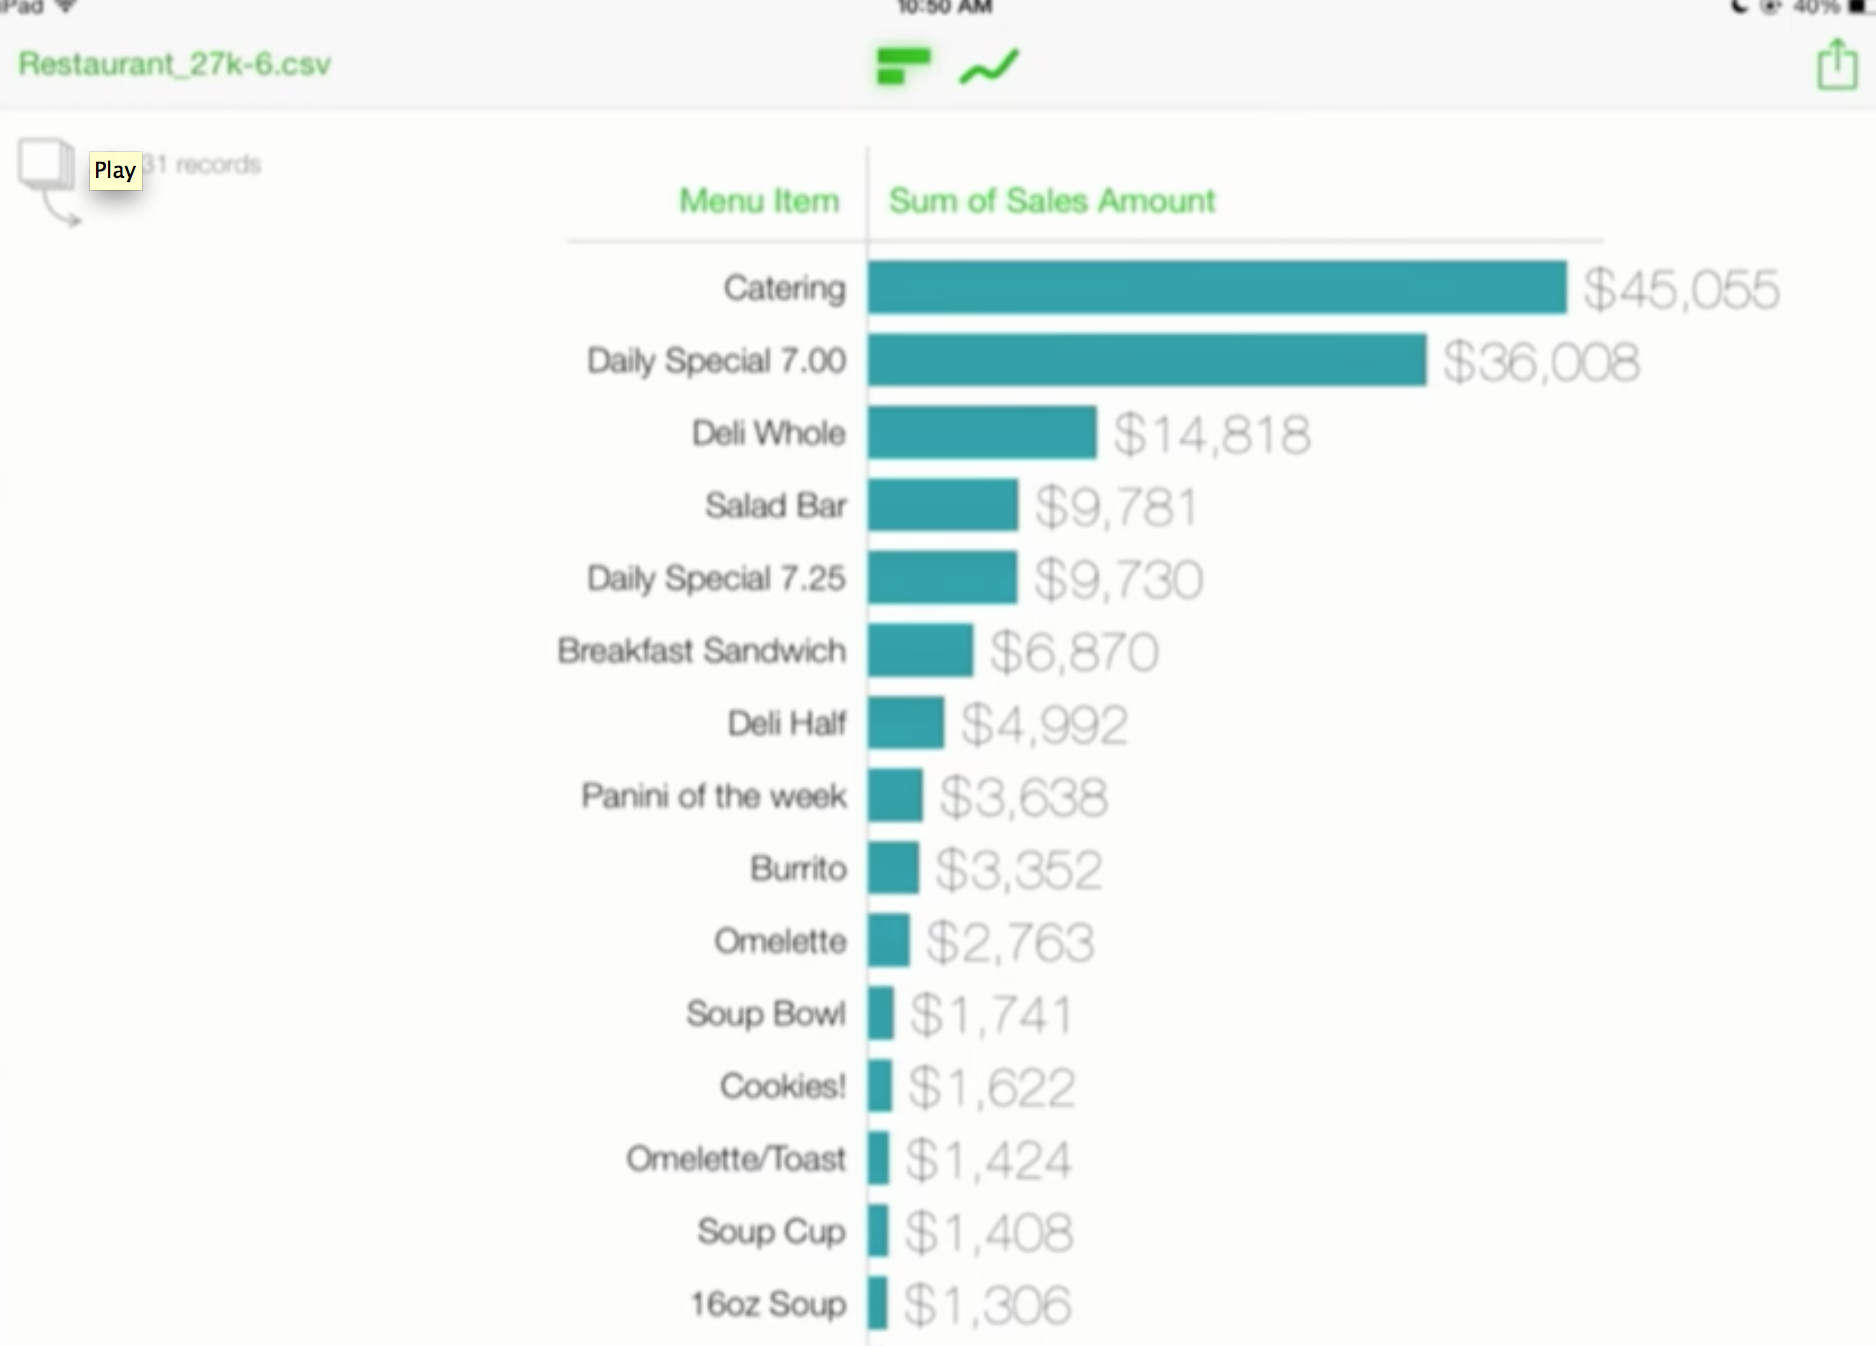
Interact with the Data
I hope you find this information useful. You can download a file with this summary: Tableau’s New Features – Keynote 2014
If you want to listen to the whole keynote, it is posted at http://tcc14.tableauconference.com/keynote.

You must be logged in to post a comment.