Coronavirus in Latin America

Coronavirus in Latin America has spread with a lag of several weeks vs. the rest of the world with most documented confirmed cases starting the first week of March. Many countries in Latin America have already established severe social distancing and lockdowns so hopefully with the benefit of early measures, the spread of the virus has the potential of being more controlled but of course it is too early to know. You can explore some of the data by clicking on this link and  exploring each of the tabs.

The data comes from the World Health Organization which lags a couple of days and I updated it frequently.

Coronavirus Stats


Data gives me peace of mind. Even when data is showing a really negative trend, it gives me a sense of control to know what is going on. So with the Coronavirus pandemic, I decided to spend some time looking at the data from the world health organization and I built a few interactive charts using Tableau public. The news are definitely not good. Especially for those of us in the USA as we are just getting started and the number of confirmed cases is growing exponentially. The death rate in the USA is lower than in other countries -for now – so that is the good news.

Here are some of the visualizations if you are interested…. Just click on Coronavirus Stats, and navigate the charts by clicking on the top tabs.

What is Analytics – The 3 Things Series

AAEAAQAAAAAAAAt_AAAAJDczYTVkZTI5LTk2ODktNGNkMi05ZDM5LTZmZDhjODIyZTAwMw

Before I embark in explaining what is Analytics, as well as the different types of Analytics, let’s just talk for a second about Why Analytics. The field of Analytics was born with the goal of using data and the analysis of that data to improve performance in key business domains, which basically means having the ability to make better decisions, and to execute the right actions based on data insight.

So what is Analytics?

The field of Analytics involves all that is necessary to drive better decision making and add value, such as Data platforms (On Premise, On Private or Public Cloud), Access to Data (Structured and Unstructured), and Tools for Quantitative Analysis and Data Visualization. In other words, Analytics is all about turning data into insight which in the world of business means turning data into competitive advantage.

Analytics Types

There are three main types of Analytics:

1- Descriptive Analytics help you understand “What happened?”. The goal of descriptive analytics like the name implies is to describe or summarize raw data and turn it into something that makes sense to the human eye – typically through presenting the data in tables or reports, or in visualizations or charts. They are very useful for understanding past behaviors, and how the past might potentially influence future outcomes.  Basic statistics like averages, sums, percent change, or proportions fit into descriptive analytics. This is the simplest form of analytics but nevertheless it is extremely useful and necessary as a stepping stone into more sophisticated/valuable analytics.

2- Predictive Analytics help you understand “What could happen?”. There are two main goals: Finding relationships or patterns and predicting what could potentially happen. They help you try to understand the future while providing actionable insights based on data. Predictive Analytics don’t provide predictions that are 100% accurate, but provide estimates about the likelihood of a future outcome. They can be used throughout an organization to forecast sales or inventories, to detect fraud, to understand customer behavior, or in any scenario where relationships among data and “predicting the future” will help make better decisions. We are all familiar with our credit scores right? That is an example of predictive analytics where historical data on how well you manage your credit is used to predict a score that can then be used as a proxy for how much of a credit risk you might be.

3- Prescriptive Analytics help you determine “What should we do?”. Prescriptive Analytics are all about providing specific guidance about what to do. They make an effort to quantify the effect of future decisions looking at the possible outcomes of each scenario before the actual decisions are made. They use a combination of business rules, algorithms, and modelling procedures to provide possible outcomes. These are typically used in Supply Chain Management, Price Optimization, Workforce planning among others. They are very useful like the name implies to “prescribe” a direction after examining multiple possible scenarios.

In summary, Analytics help you turn your data into insight for better decision making and there are 3 main types of Analytics that you use depending on your goal. Descriptive analytics to understand what has happened in the past, Predictive analytics to understand relationships among data and provide predictions about what may happen in the future, and Prescriptive analytics to provide specific recommendations about what to do in specific scenarios.

Enterprise Business Intelligence Platforms – At a Glance

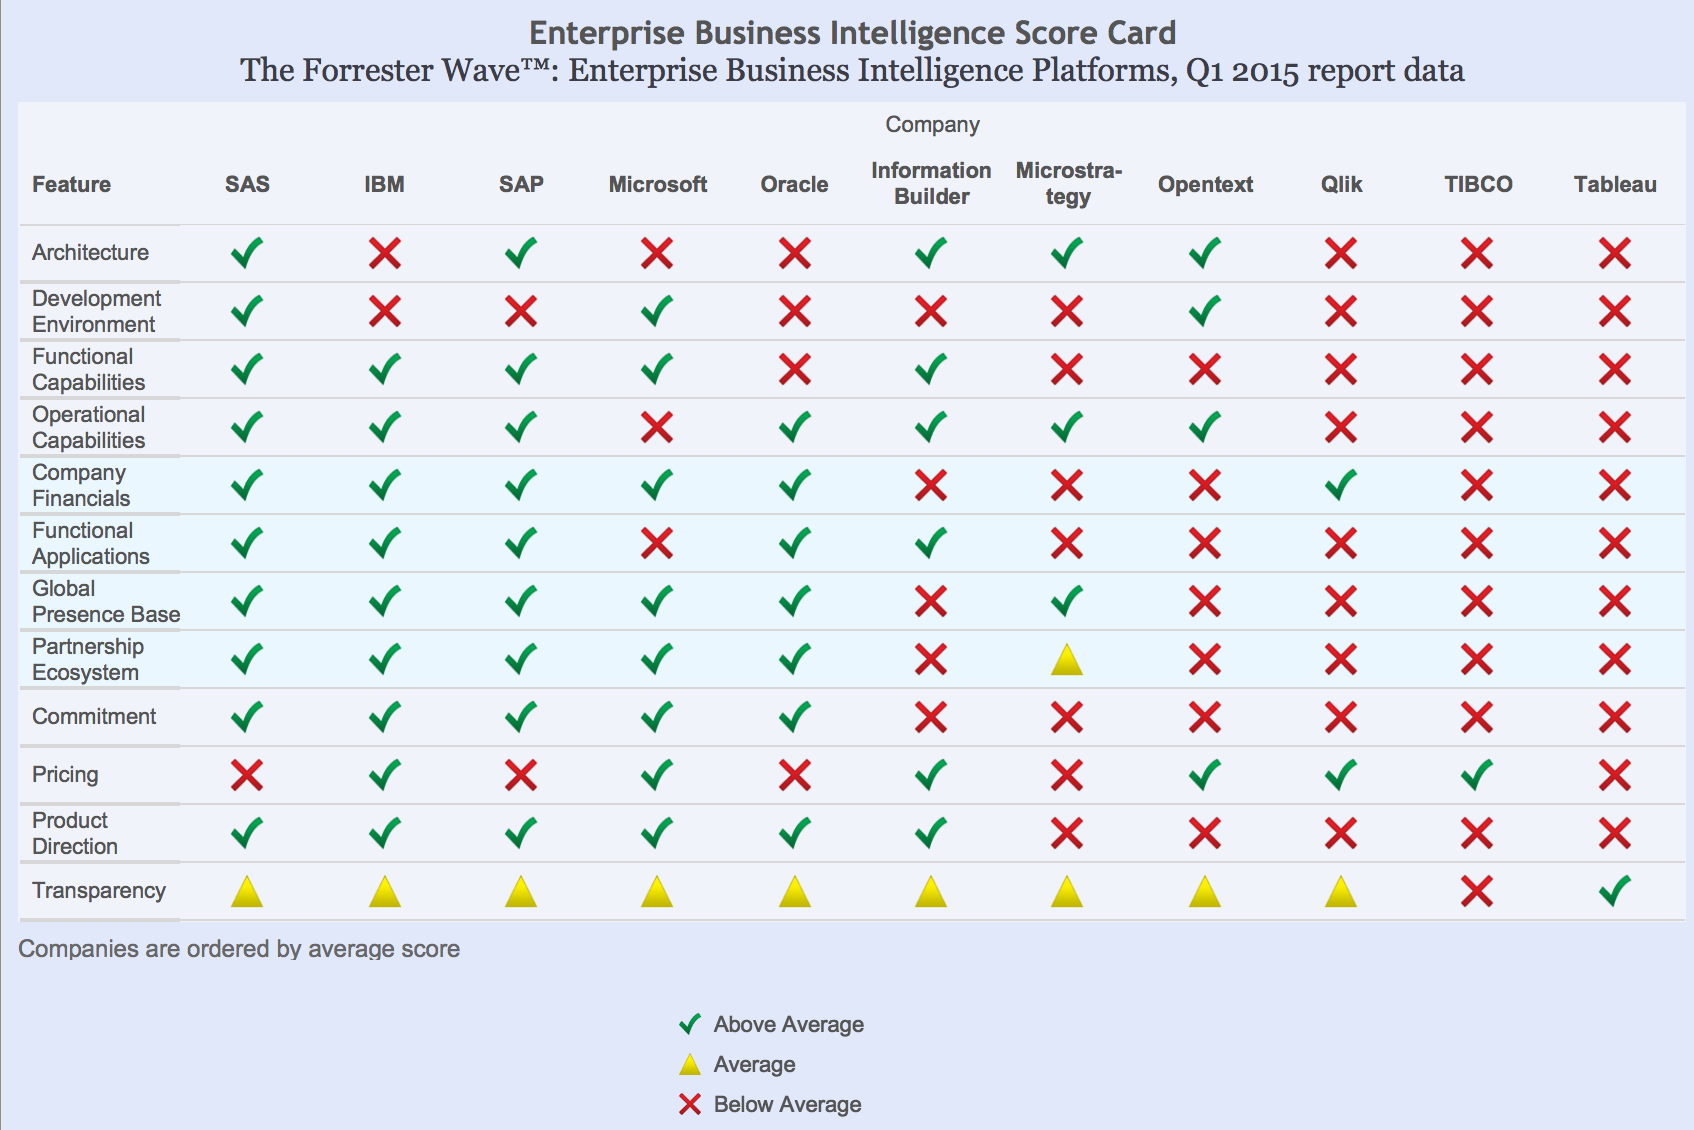
Industry analysis reports are always packed with great information, lots of it.  Data visualization however helps better understand the conclusions reached by Forrester in their The Forrester Wave™: Enterprise Business Intelligence Platforms, Q1 2015 report.  11 vendors in this industry are included.

Table 1 shows the summary scorecard, and details are presented below the table.

Table 1 - Enterprise Business Intelligence Scorecard

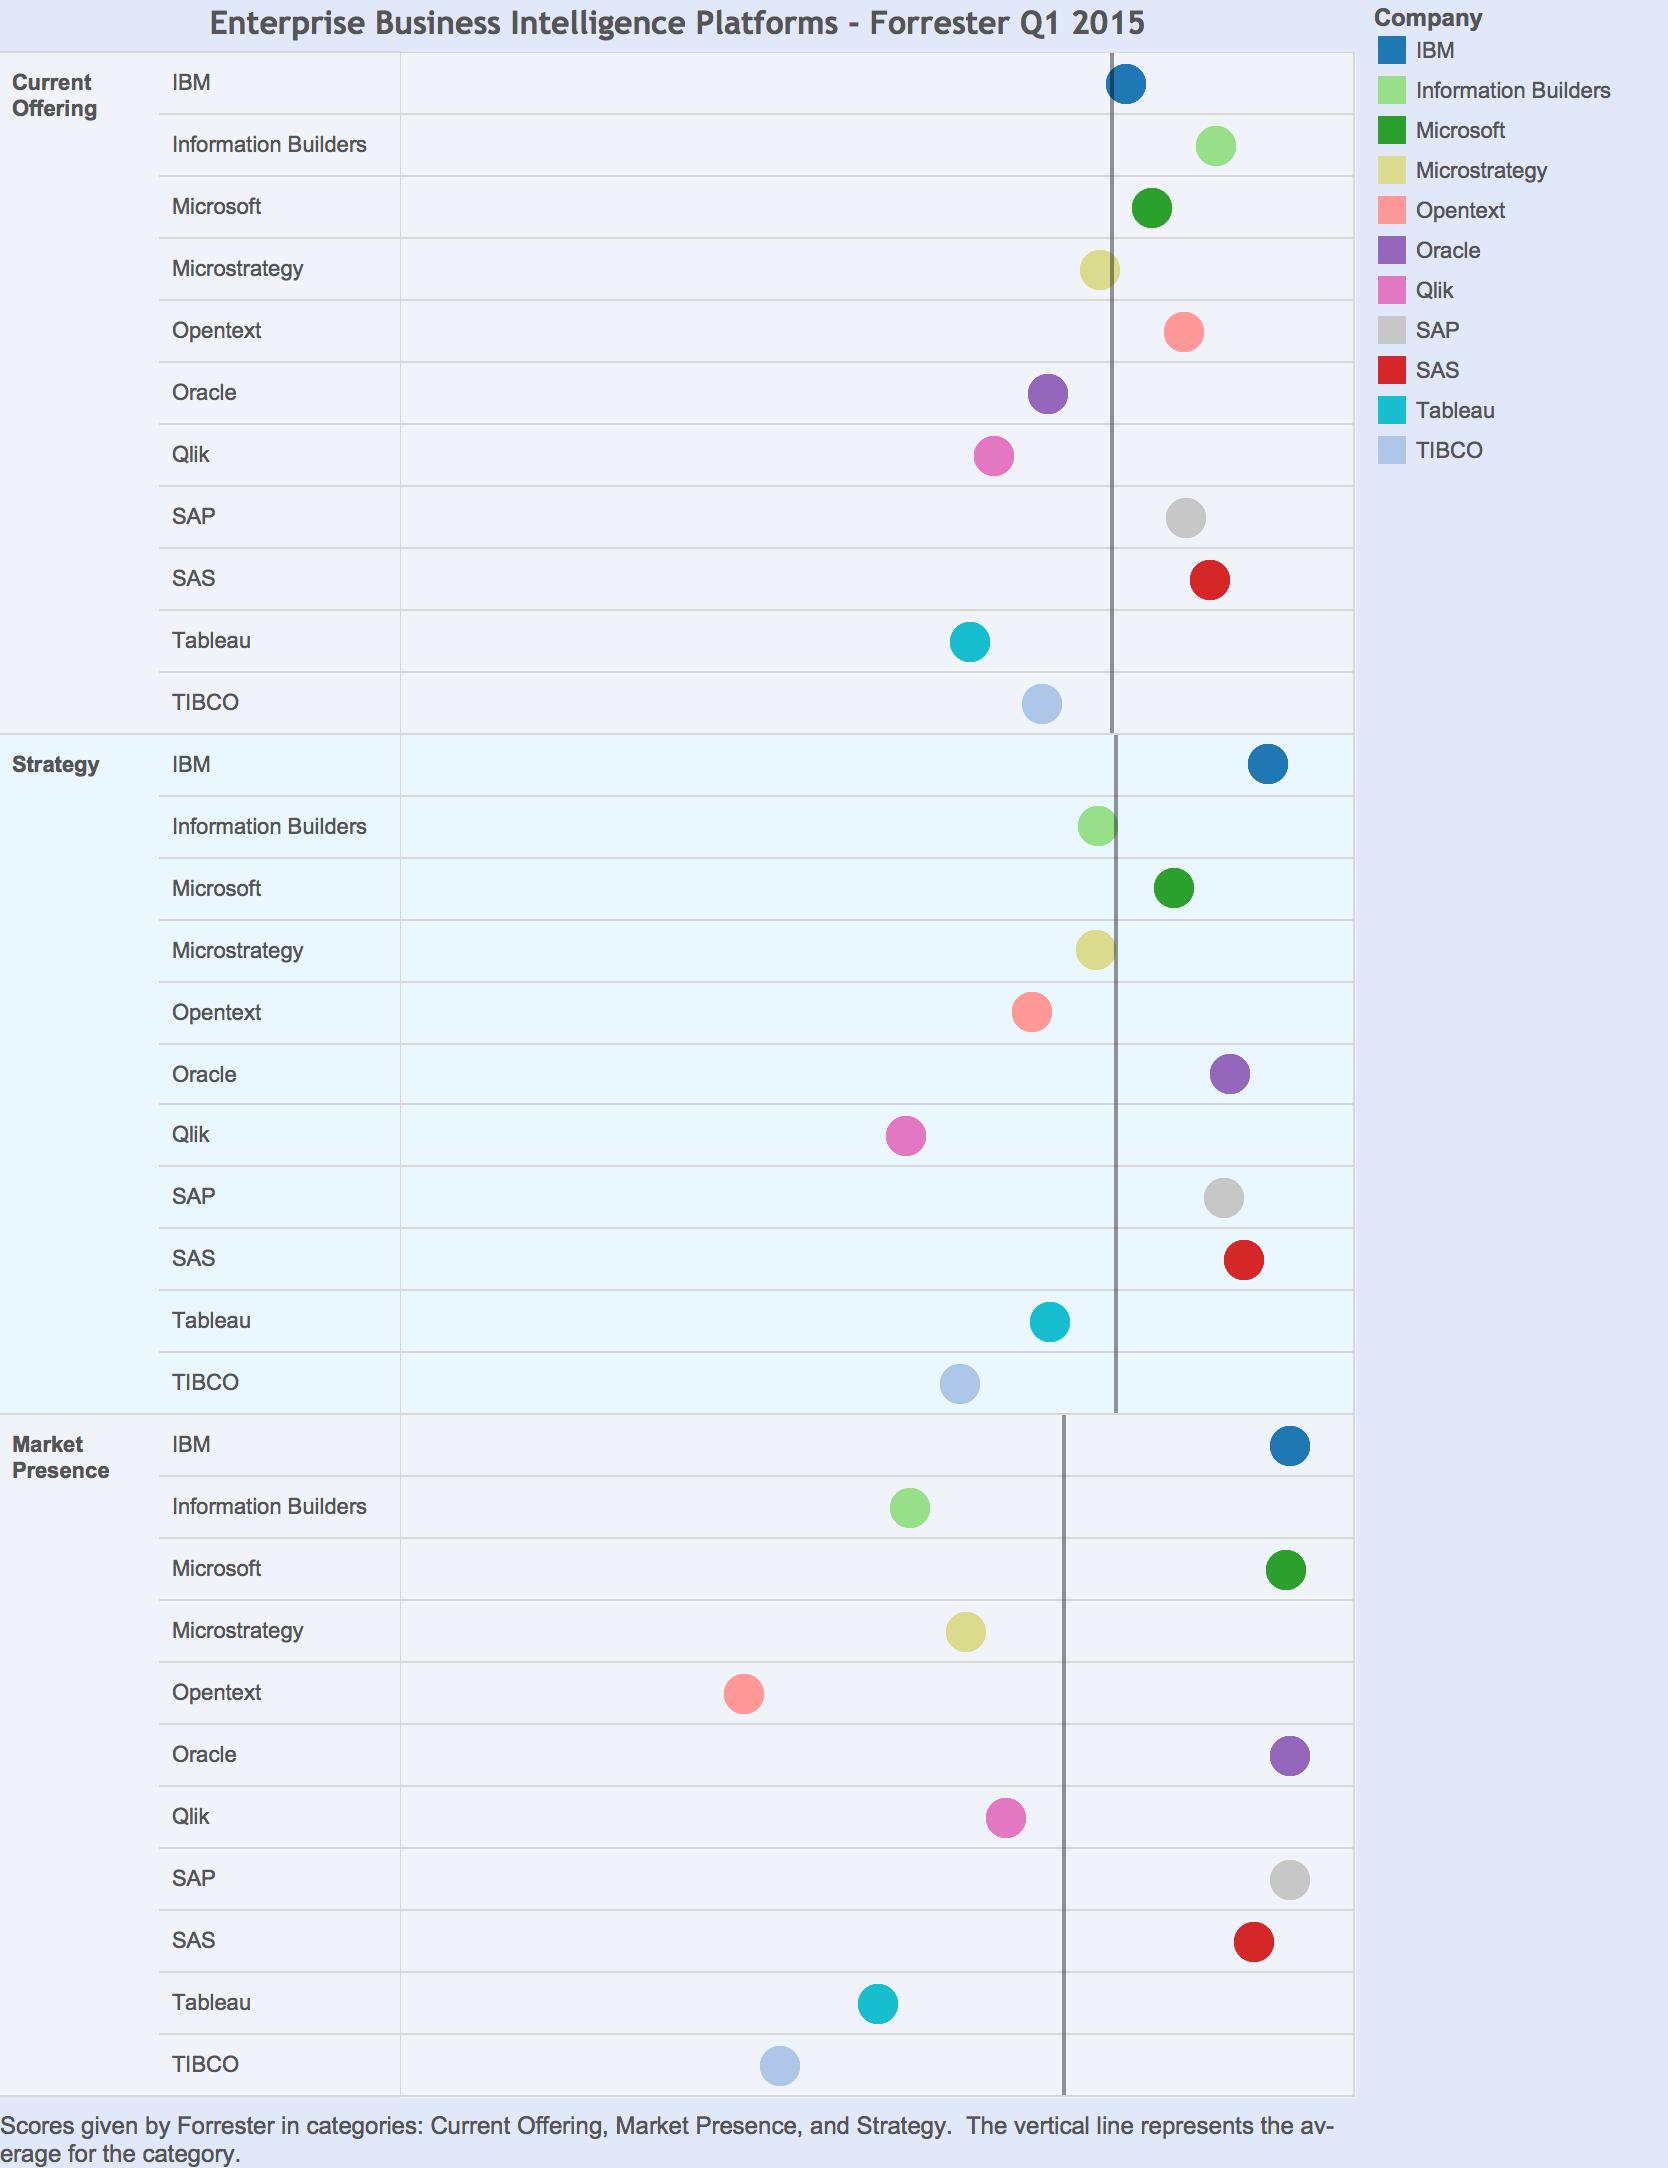
Table 1 – Enterprise Business Intelligence Scorecard

The top level comparisons involve 3 categories: Current Offering, Strategy, and Market Presence.

The Forrester Wave™: Enterprise Business Intelligence Platforms, Q1 2015

Vendors with above-average scores

Current Offering: IBM, Information Builders, Microsoft, Opentext, SAP, SAS

Strategy: IBM, Microsoft, Oracle, SAP, and SAS

Market Presence: IBM, Microsoft, Oracle, SAP and SAS

We can also look at the scores that went into every one of these categories and see how vendors compare at a more granular level.

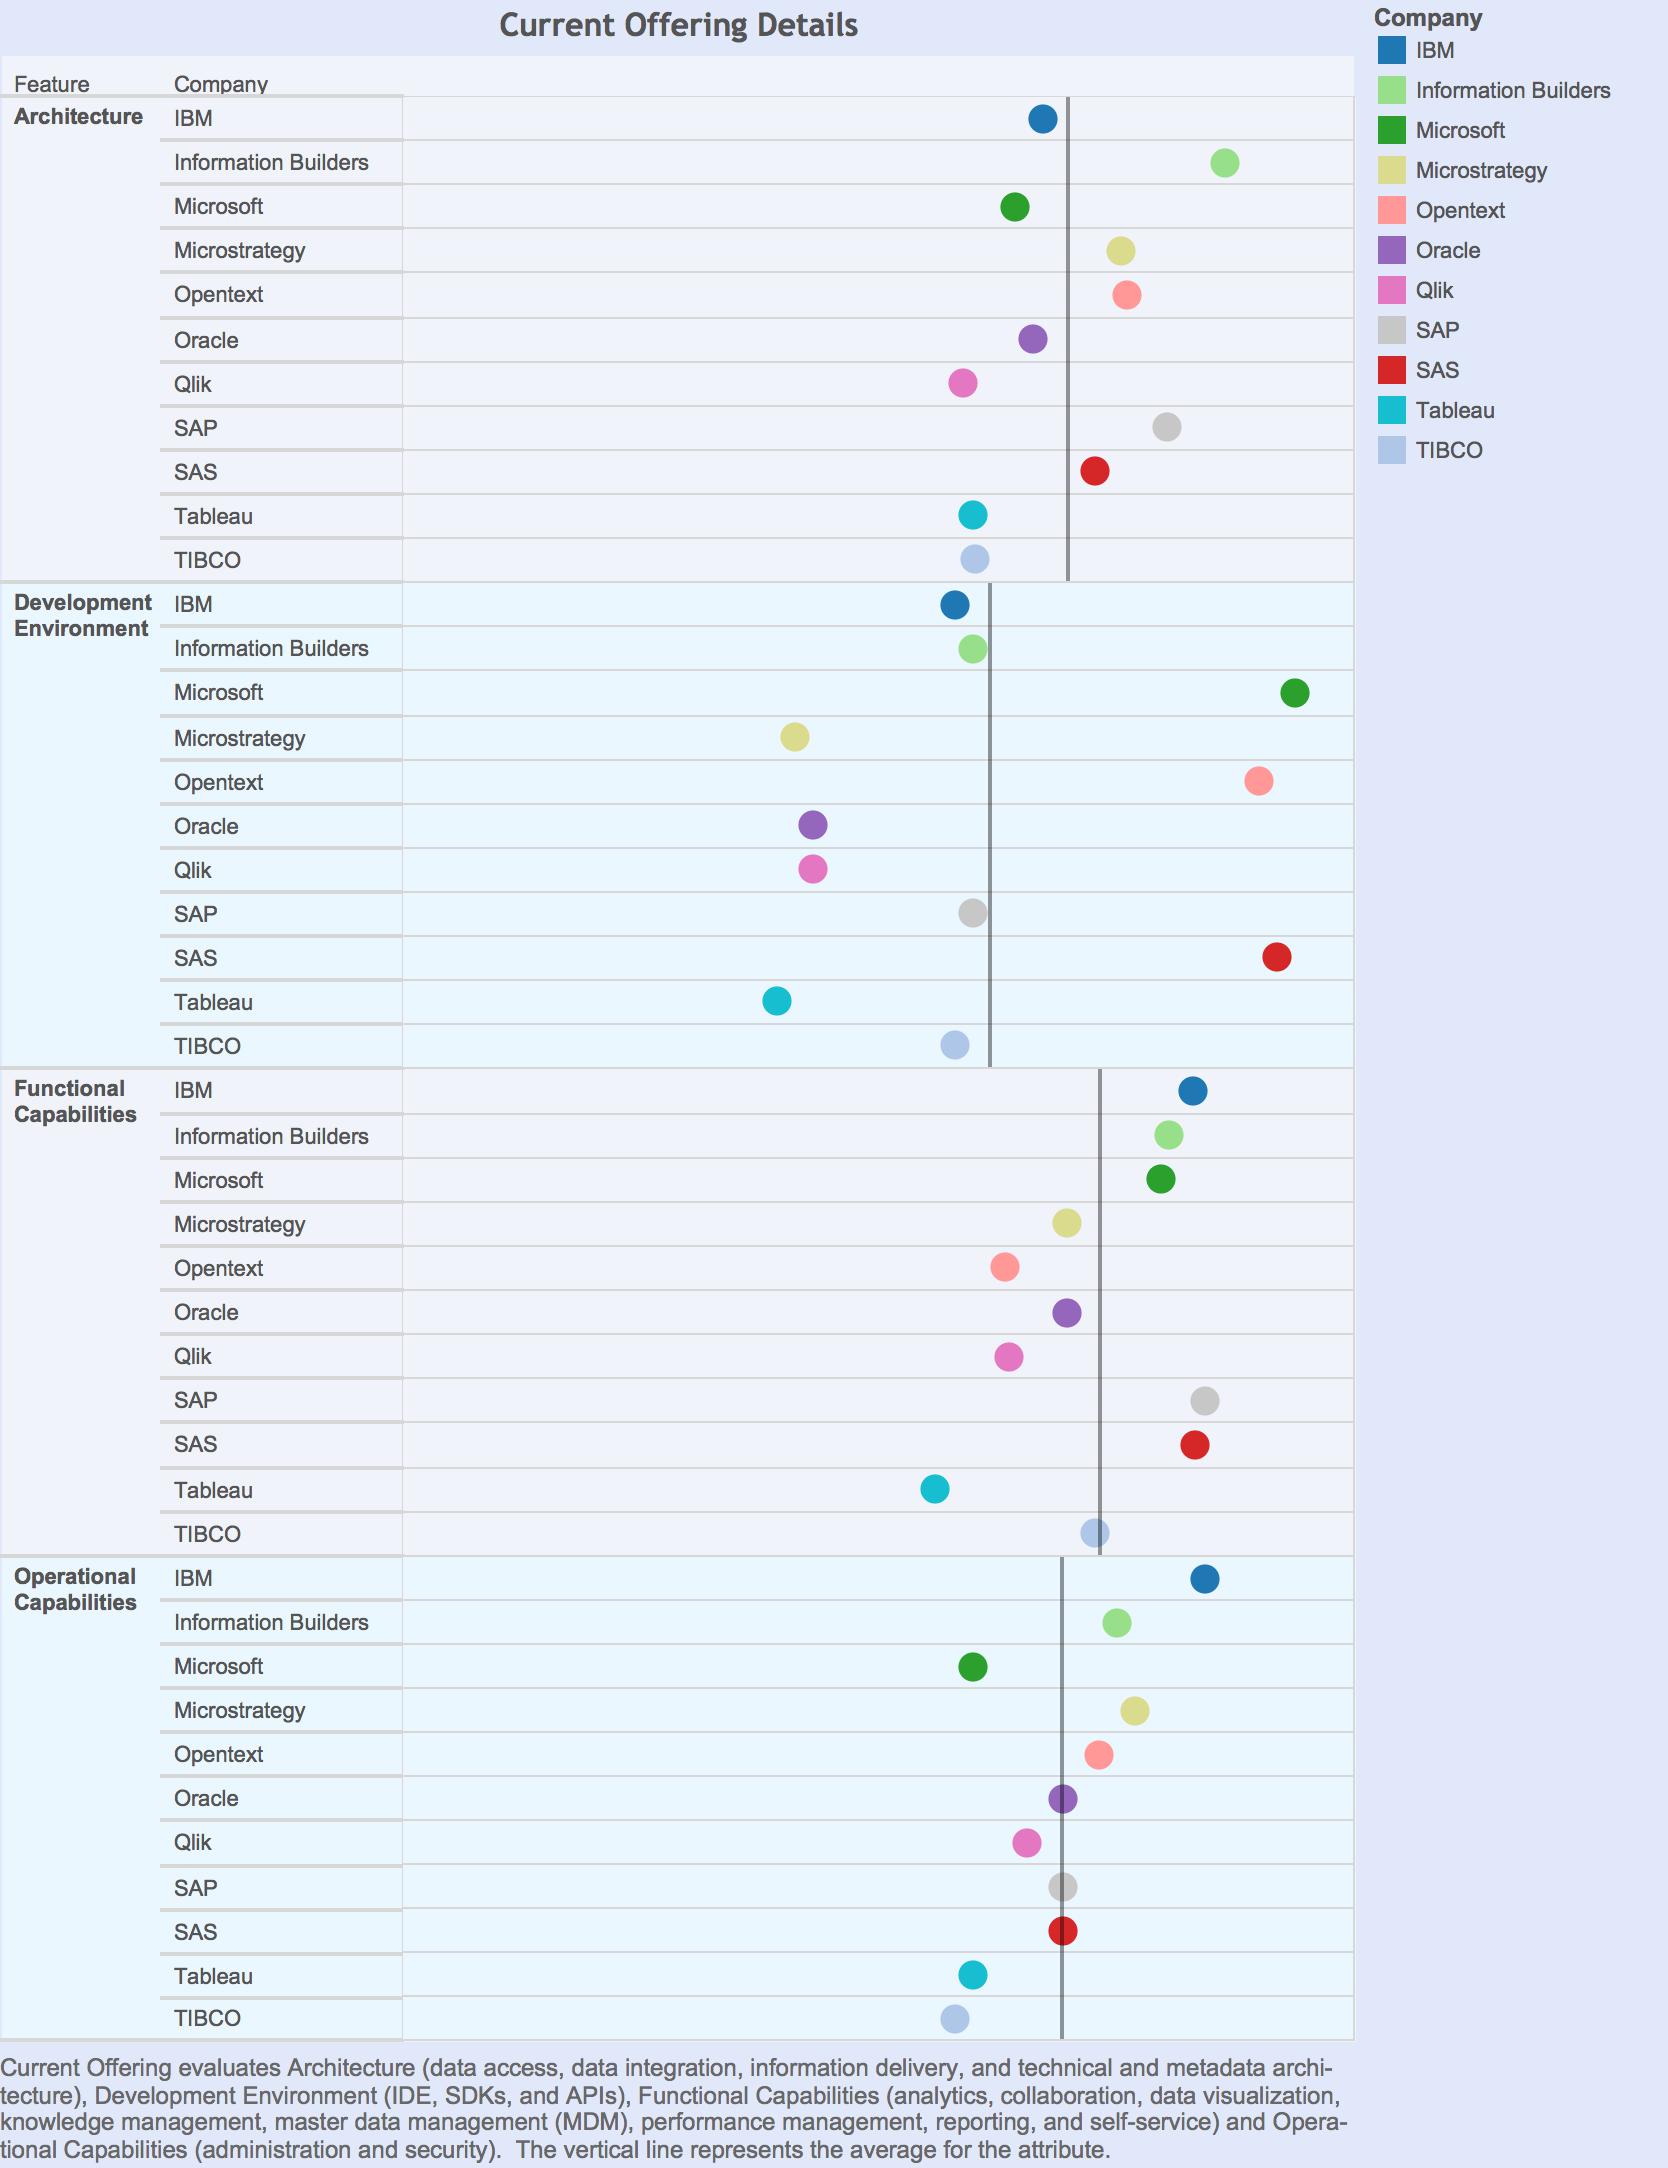
Current Offering Details

Forrester Evaluation Business Intelligence Current Offerings

Vendors with above-average scores for Current Offering

Architecture: Information Builders, Microstrategy, Opentext, SAP, SAS

Development Environment: Microsoft, Opentext, and SAS

Functional Capabilities: IBM, Information Builders, Microsoft, SAP and SAS

Operational Capabilities: IBM, Information Builders, Microstrategy, Opentext
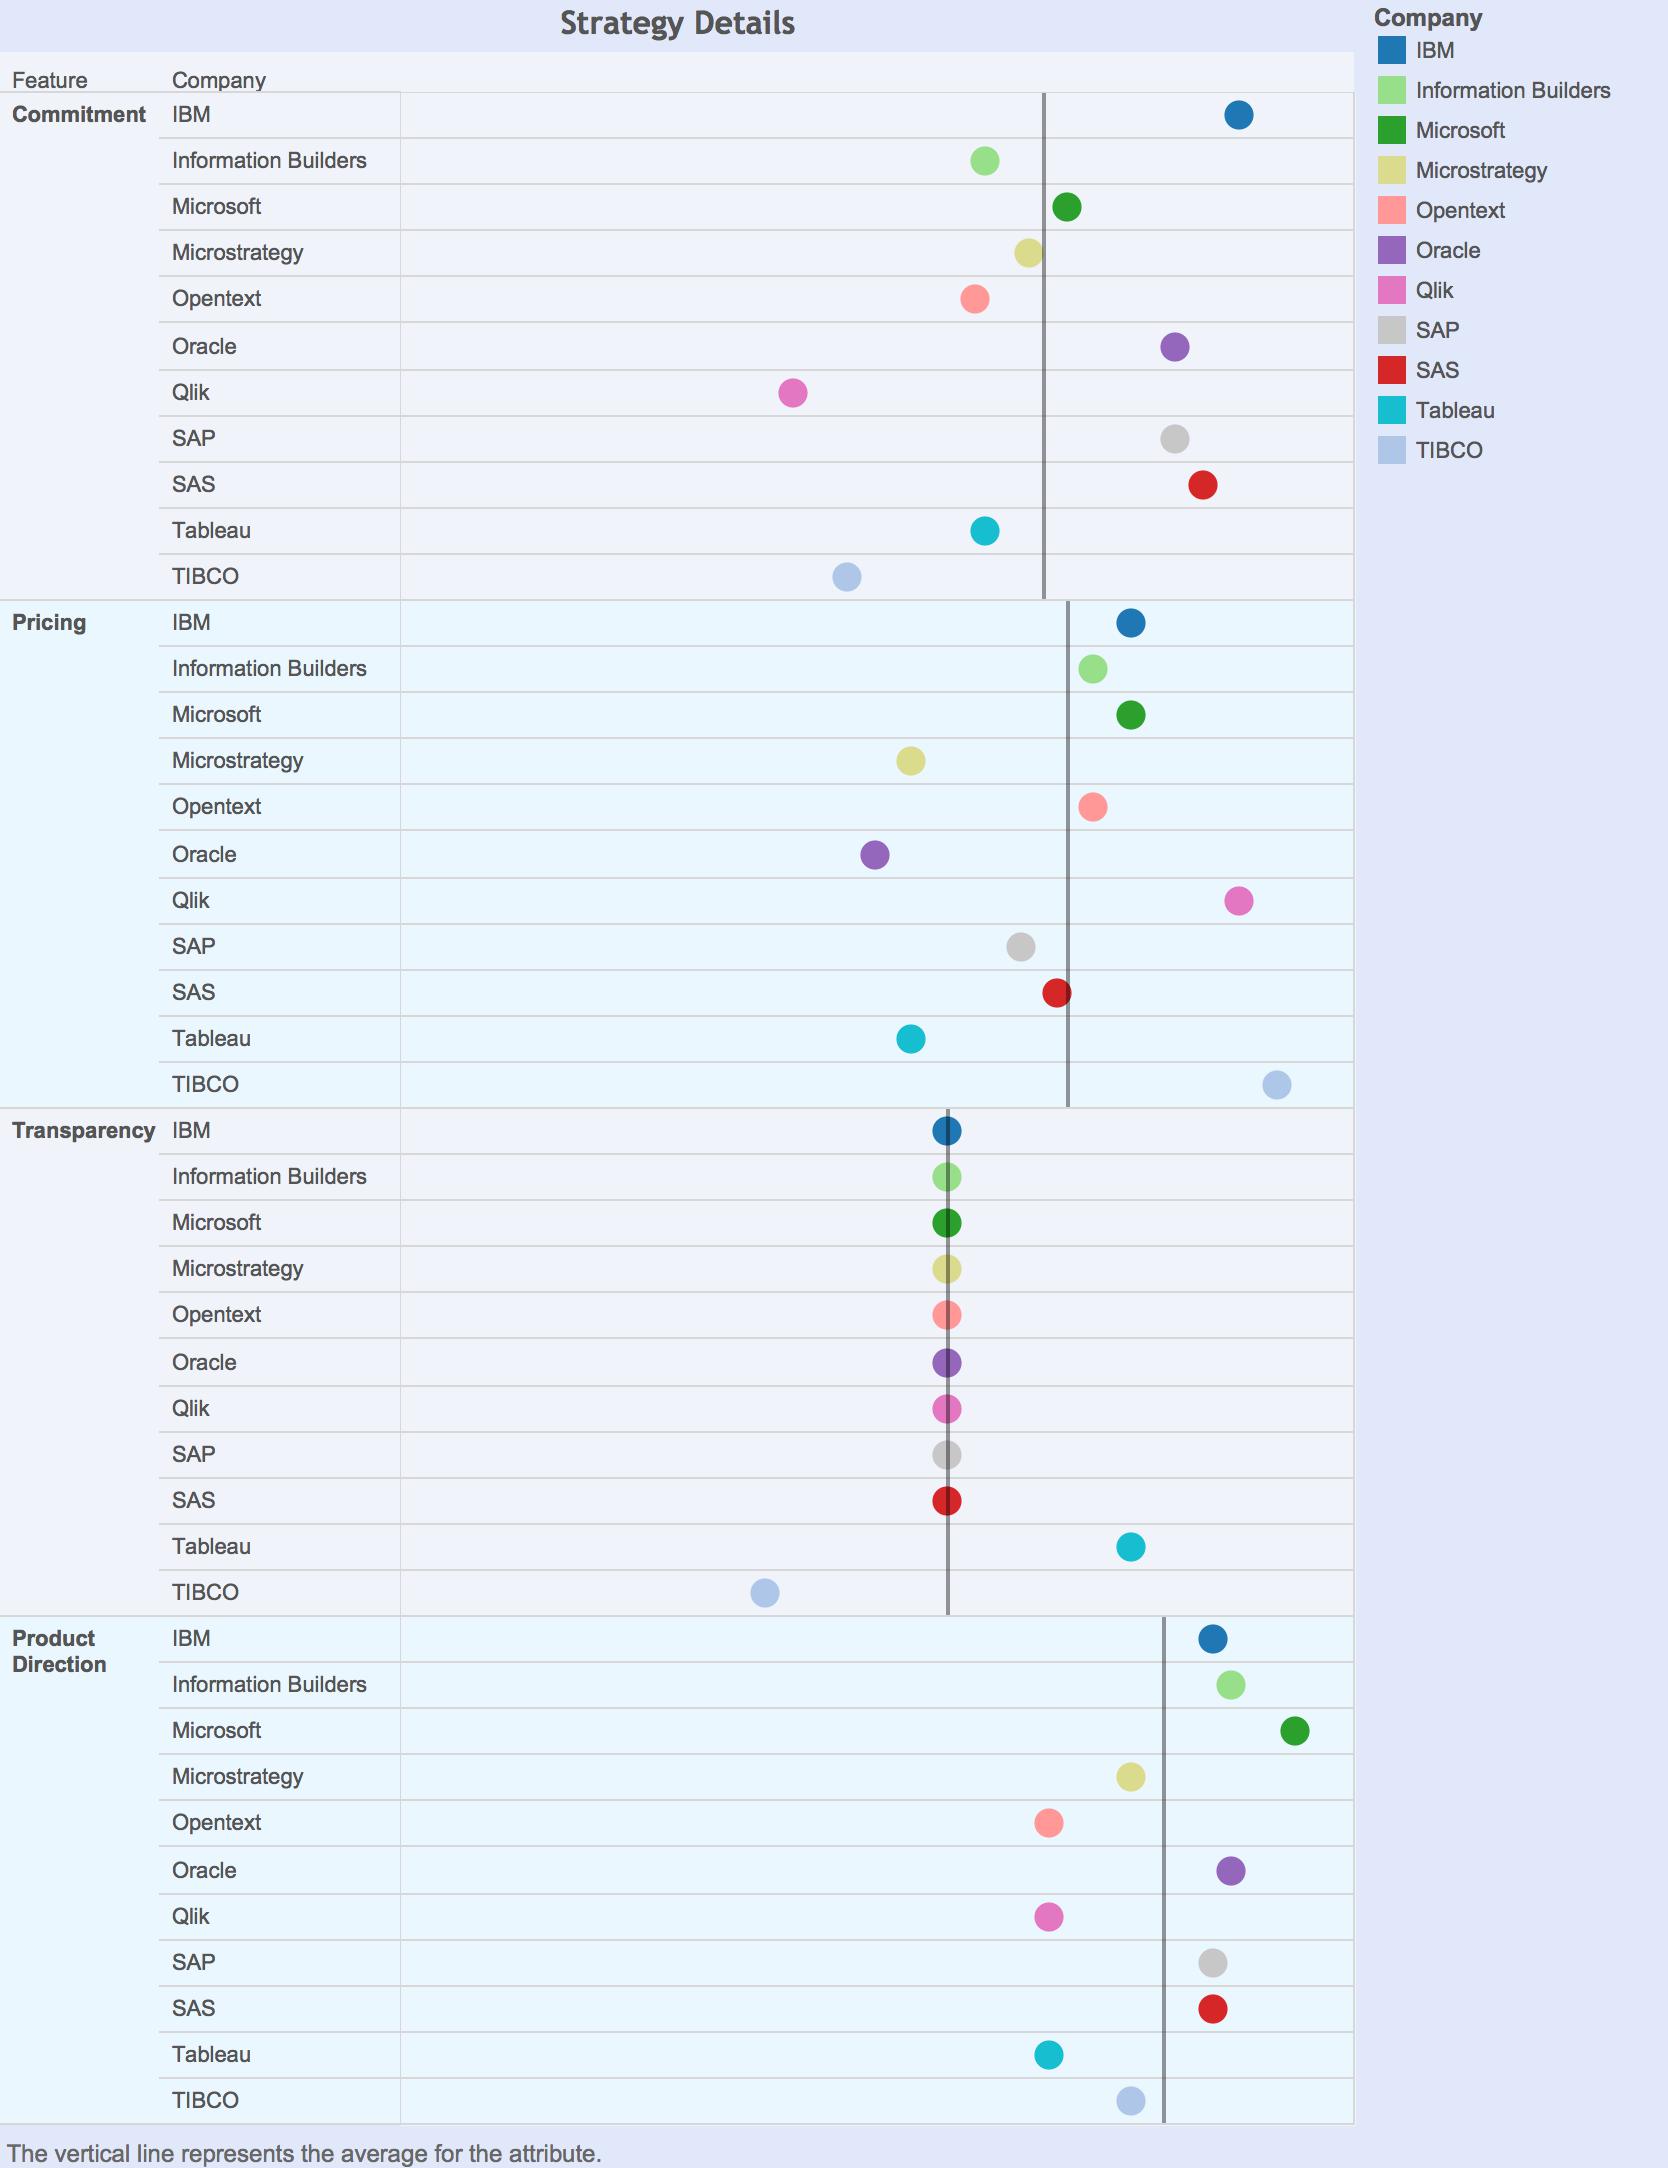
Strategy Details

Forrester Enterprise Business Intelligence Strategy Comparisons

Vendors with above-average scores for Strategy

Commitment: IBM, Microsoft, Oracle, SAP, SAS

Pricing: IBM, Information Builders, Microsoft, Opentext, Qlik and TIBCO

Transparency: Tableau

Product Direction: IBM, Information Builders, Microsoft, Oracle, SAP, and SAS

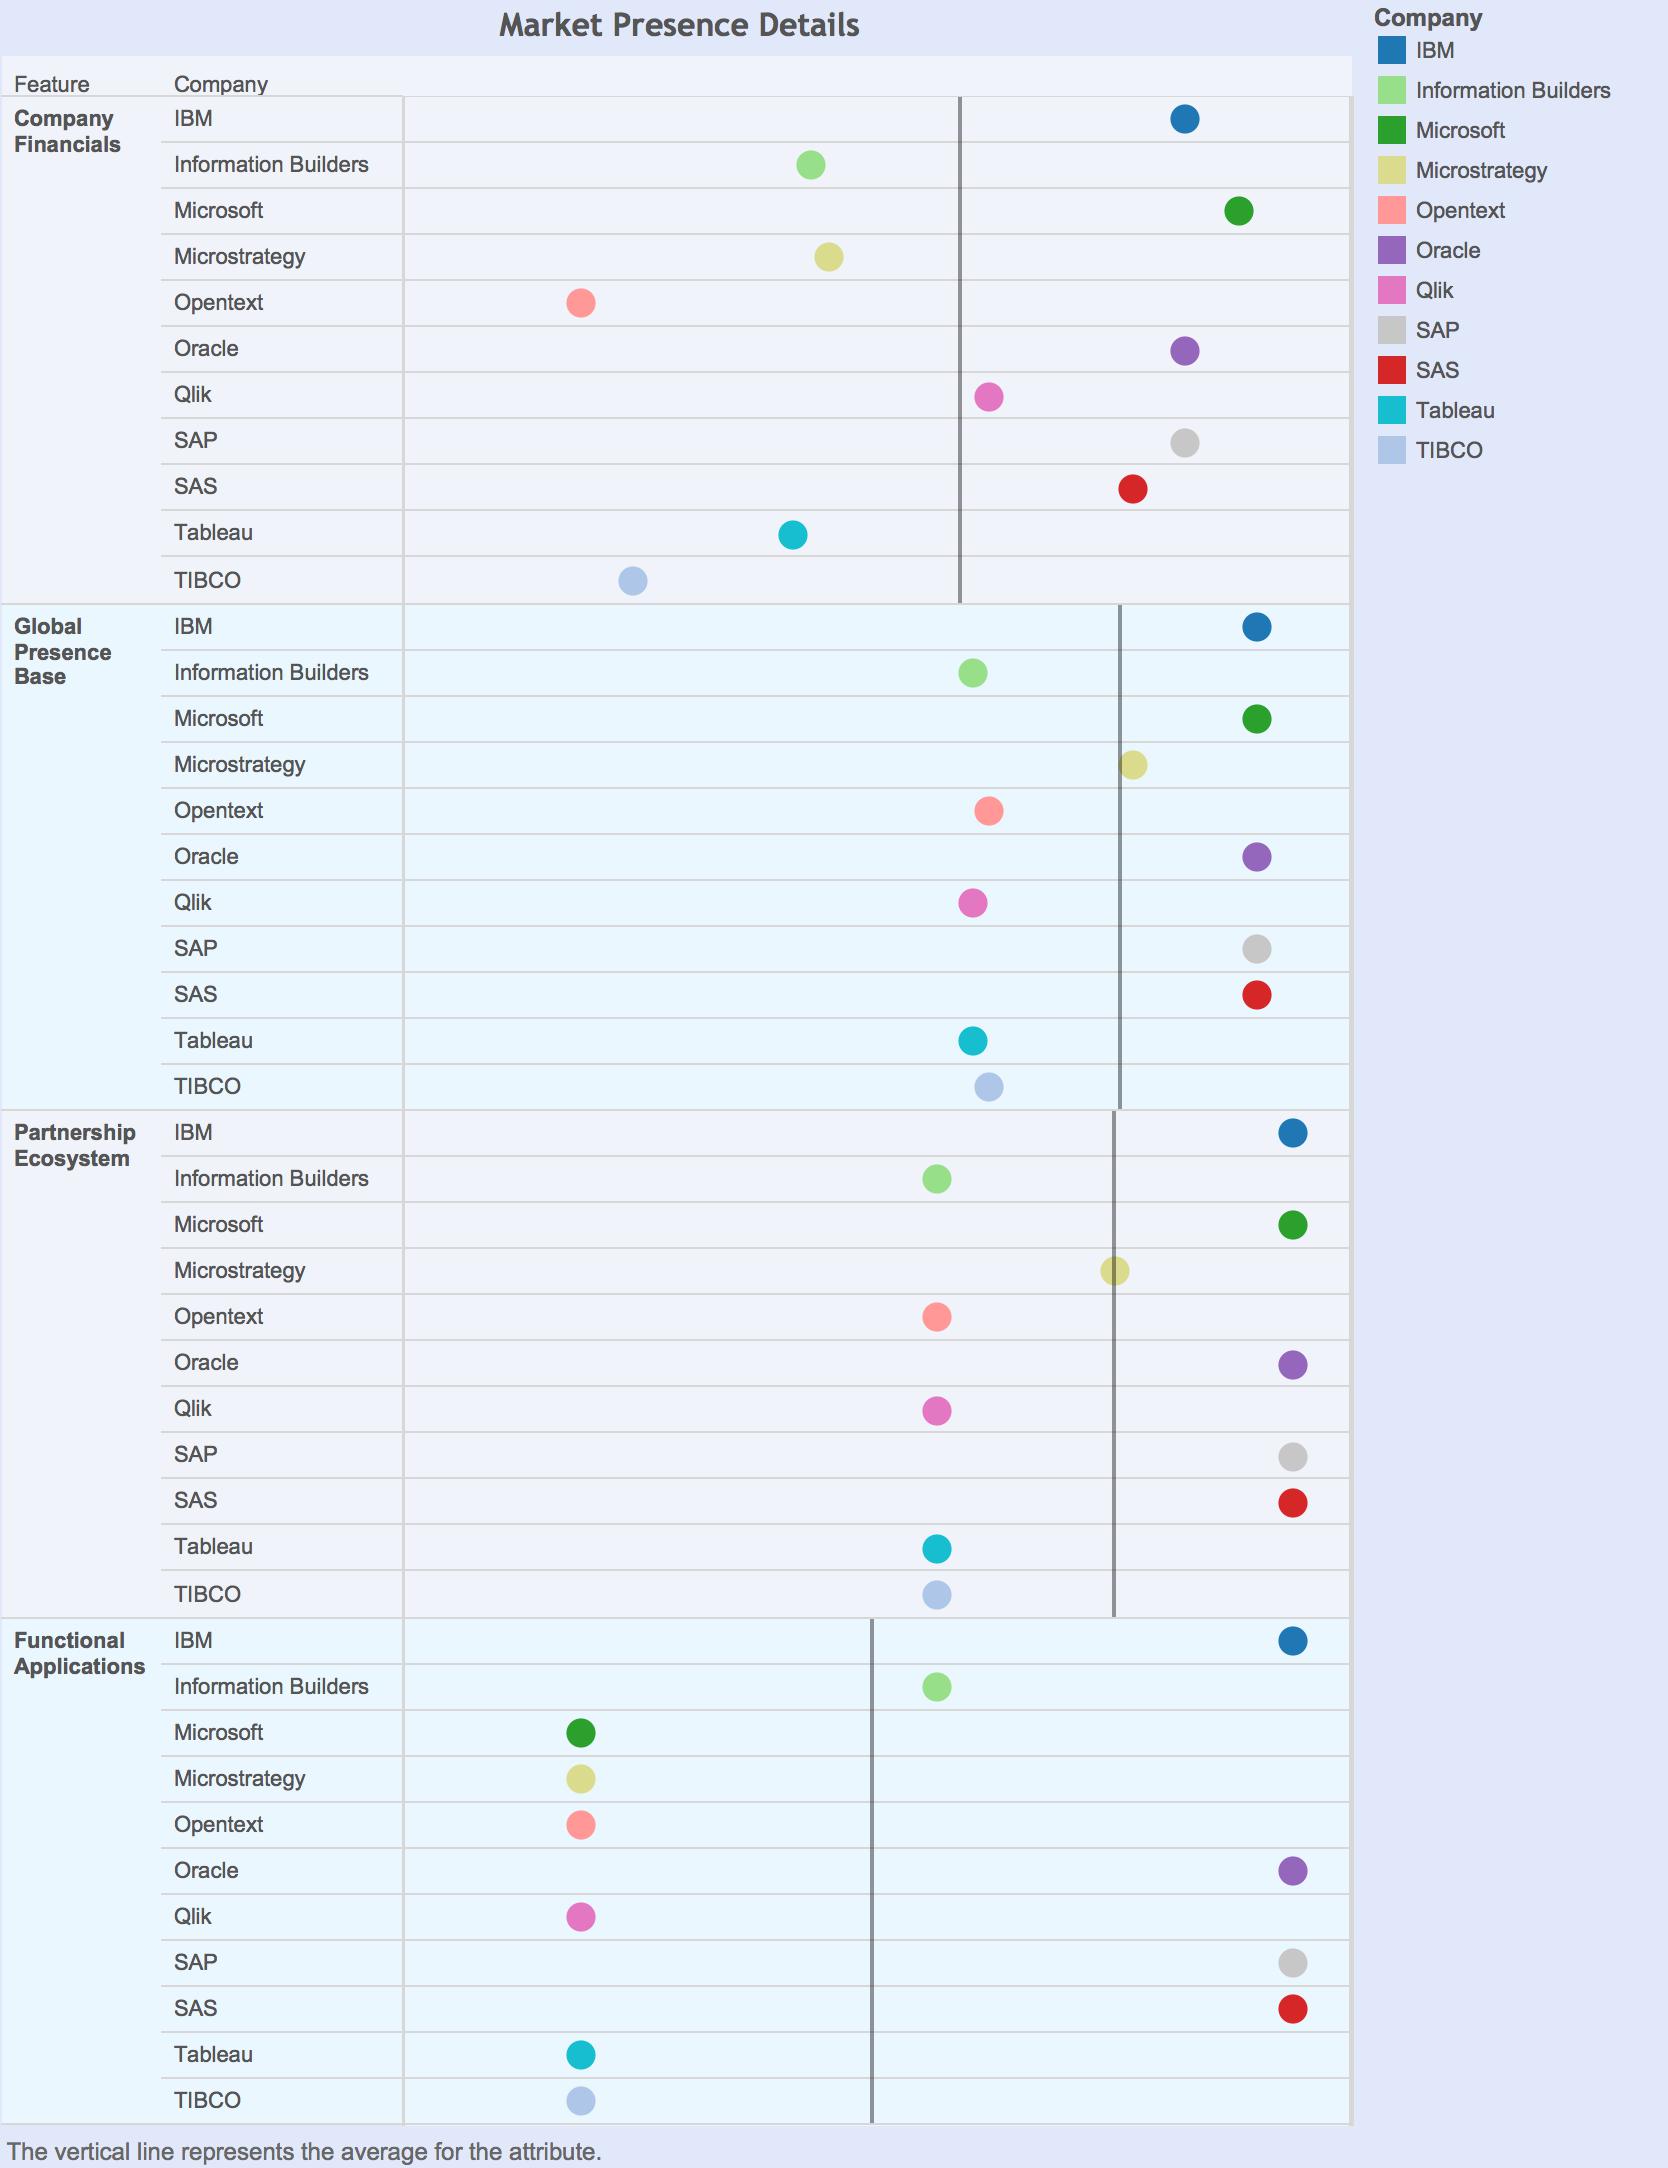
Market Presence Details

Forrester Enterprise Business Intelligence - market presence evaluation

Vendors with above-average scores for Market Presence

Company Financials: IBM, Microsoft, Oracle, Qlik, SAP, SAS

Global Presence Base: IBM, Microsoft, Microstrategy, Oracle, SAP, and SAS

Partnership Ecosystem: IBM, Microsfoft, Oracle, SAP, and SAS

Functional Applications: IBM, Oracle, SAP, and SAS