
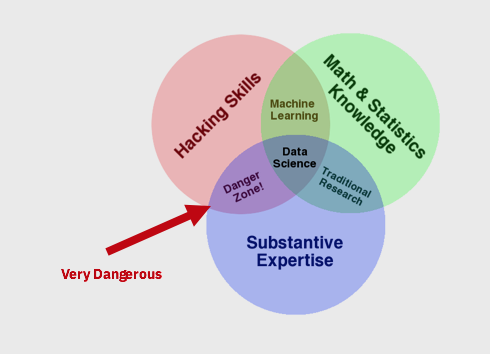
The foundation of Data science lies on a set of math and statistics knowledge which provides the ability to understand and model datasets. Because data modeling algorithms may look to the untrained eye like simply a collection of lines of code, those jumping into modeling data without the statistical or mathematical background, may end up making serious mistakes that would nullify the results of any analysis done.
If you are serious about becoming a Data Scientist, avoid the temptation of jumping into modeling data first. Instead, ensure you have the right math and statistical foundation in place before learning how to build models. For details on the overall skills required to be a Data Scientist, read my previous blog What are the skills that define the role of Data Scientist? For resources on alternatives to become a Data Scientist, read Where do Data Scientists come from?
There are multiple ways to get skills to become a Data Scientist, but independently of the option you choose, make sure the right foundation is built into the program, or find ways to build the foundation yourself either through college classes, digital classes, or even through good old fashion academic books. Specifically, what math knowledge should you have? here is a summary of some of the most common math knowledge needed:
Probability Foundation
What is Probability?, Sample Spaces, Properties/Rules of Probability, Probability of combination of events (Intersection of events, Union of events, Contingency Tables), Conditional Probabilities, Independent vs. Dependent Events, Bayes’ Theorem, Counting Principles (permutations, Combinations), Sampling Techniques, Probability Distributions (Continuous and Discrete Random Variables, Cumulative Distribution, Binomial Distribution, Poisson Distribution, Geometric Distribution, Exponential Distribution, Normal Distribution, Chi-Square Distribution, Expected Values)
Statistics Foundation
- Descriptive Statistics: Quantitative Data vs. Qualitative Data, Types of measurements: nominal, ordinal, intervals, ratios, Frequency Distributions, Relative Frequency Distributions, Cumulative Frequency Distributions, Measures of Central Tendency: Mean, Median and Mode, Measures of Dispersion: Range, Variance, Standard Deviation, Measures of Relative Position: Quartiles, Interquartile Range, Outliers, The empirical rule (normal distributions) and Chebyshev’s Theorem, Visualizing Data: Histograms, Stem and Leaf, Box Plots
- Inferential Statistics: Sampling distribution of the mean, Sampling Distribution of the Proportion, Standard Error of the Mean, The Central Limit Theorem, Confidence Intervals and their interpretation, Effects of changing confidence levels and sample sizes, Working with small vs large samples, Formulating and testing hypothesis, The Null and Alternative Hypothesis, Type I and Type II Errors, 1-tail vs 2-tail hypothesis, Testing the Mean and the proportion of a population using 1 sample, Testing the difference in means and proportions using 2 samples, Analysis of Variance (ANOVA) comparing 3 or more population means, Understanding the role of Alpha and the p-value, Working with Dependent vs. Independent samples, Correlation and Simple Regression (confidence intervals, hypothesis test on the regression line, regression assumptions), Multiple Regression (assumptions, multicollinearity)
Linear Algebra Foundation: Vectors and Real Coordinate Spaces (Adding, Subtracting, and multiplying vectors by a scalar, Linear Combinations, Linear dependence and independence), Matrix Transformations (Functions and Linear Transformations, Inverses and determinants, Matrix Multiplications, Transpose), Orthogonal Complements and Projections, eigenvectors, eigenvalues.
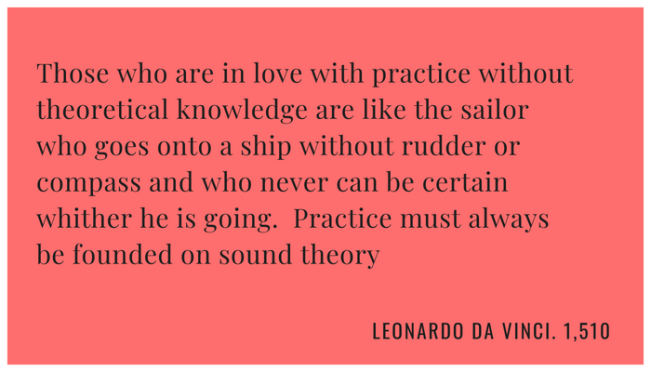
The bottom line is that when you move from working in a deterministic world to probabilistic world, it is important to understand the implications of this paradigm change.


You must be logged in to post a comment.